Shows the KPI cards of the administration dashboard, with the chart of the selected KPI below them. While you present, click a KPI card to show that KPI in the chart.

Options

Under Display options, choose the dashboard to show. By default, it’s Same as portal: the dashboard the administration uses in aiGust. You can choose another dashboard, such as one of your firm’s KPI dashboard templates.

Display options with the dashboard selector set to Same as portal, with the aiGust badge.

The options of the Dashboard widget.

Where it fits

A large zone. Use a layout with one data zone.
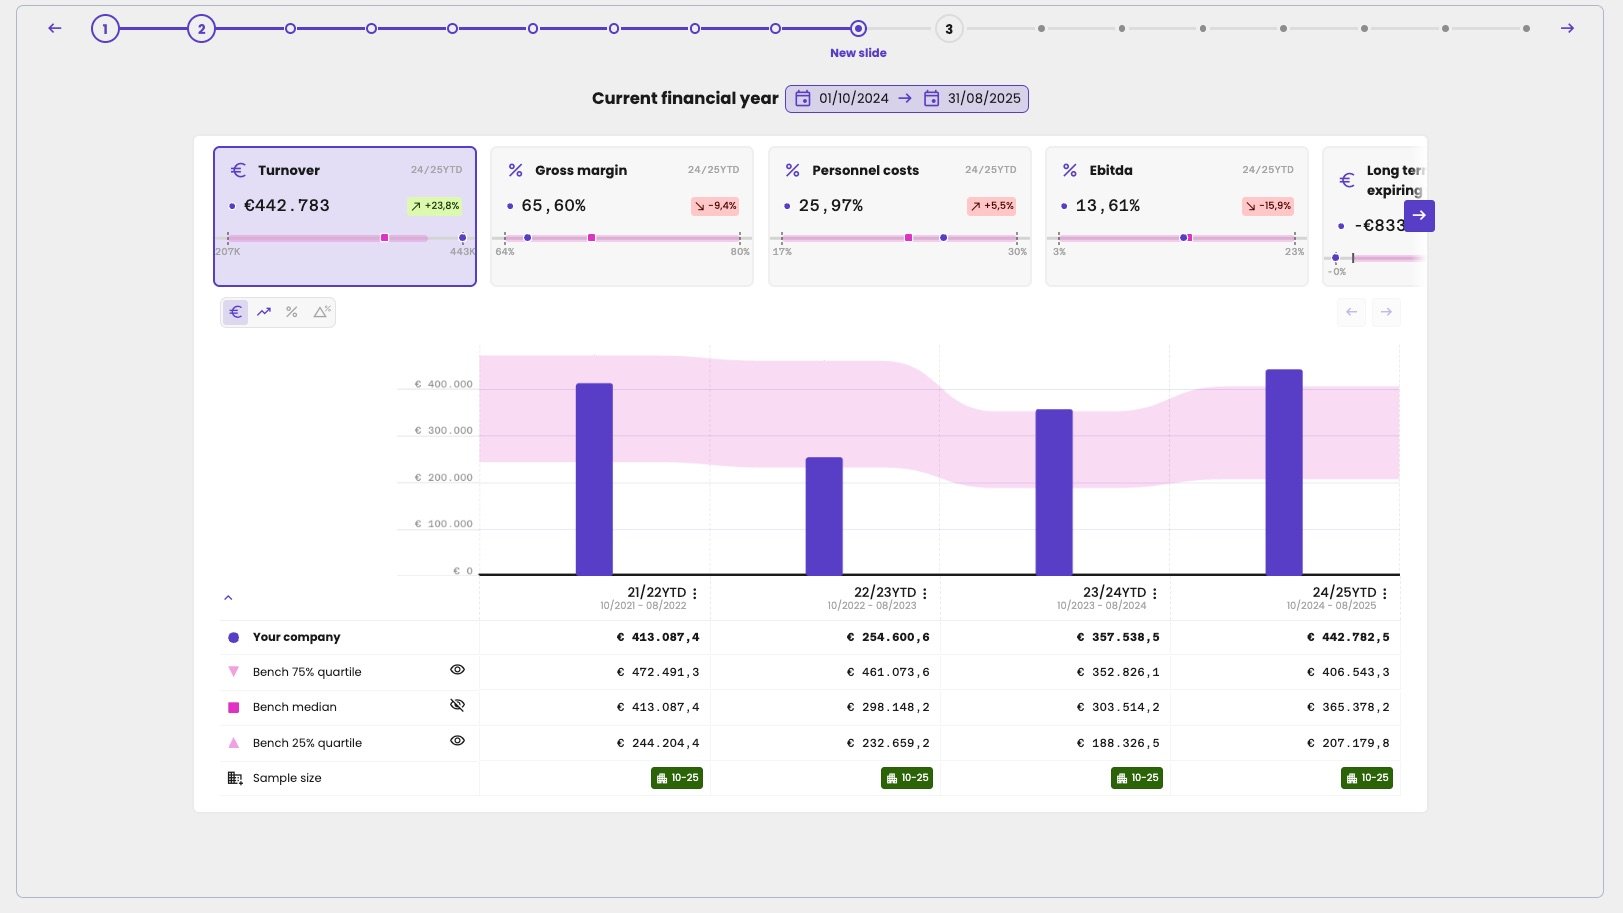
A slide for Current financial year 01/10/2024 to 31/08/2025 with a row of KPI cards for 24/25YTD: Turnover €442,783 (+23.8%, selected), Gross margin 65.60%, Personnel costs 25.97% and Ebitda 13.61%, each with a benchmark bar, and an arrow to scroll to more cards. Below, the Turnover chart for 21/22YTD to 24/25YTD with the benchmark band and a table with Your company, the bench quartiles, the median and the sample size.

The Dashboard widget on a slide. Turnover is selected, so the chart below shows the turnover with its benchmark.