

Create a forecast
- Click Create.
- Check the Period to forecast. It runs from the period after the up-to-date-until date to the end of the financial year.
- Change the name if you want. aiGust proposes one, such as Forecast end 2026 (september).
- Click Let’s go!
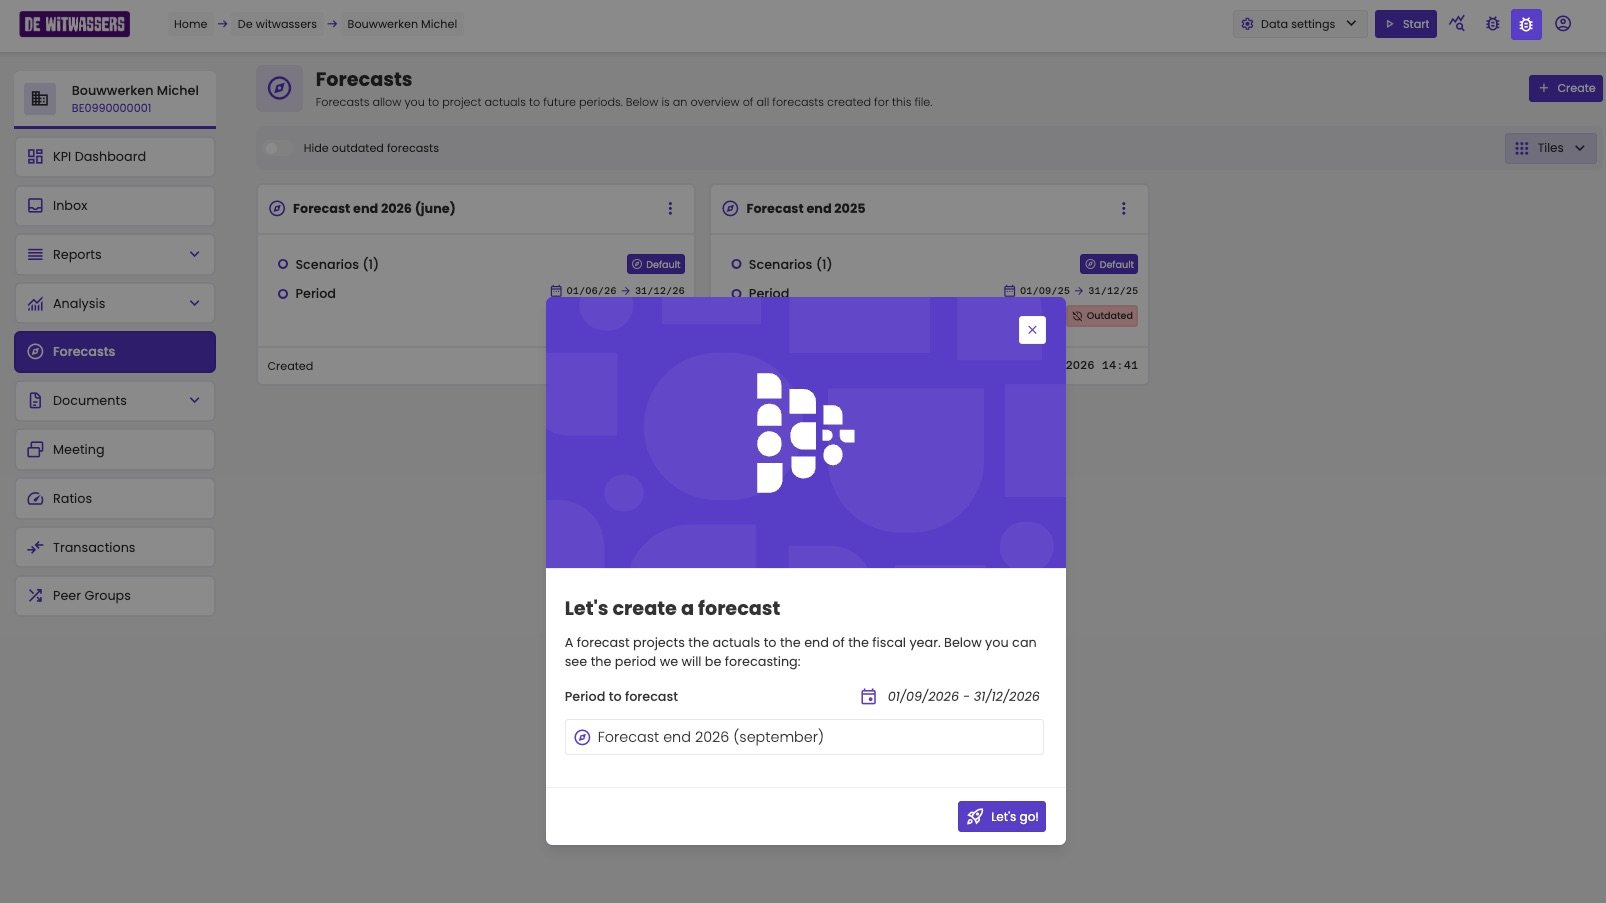
Create a forecast for the rest of the financial year.
The forecasts overview
Each forecast is shown as a tile, with:- Scenarios, with the number of scenarios and a badge for each one.
- Period, the period the forecast covers.
- Created, the date and time the forecast was created.
- Overlapping: the forecast is still useful, but actual figures are now available for some of its periods. For example, a forecast for 02/2026 to 12/2026, when the figures are up to date until 31/05/2026.
- Outdated: the whole forecast period is in the past. For example, a forecast for 09/2025 to 12/2025, when the figures are up to date until 31/05/2026.
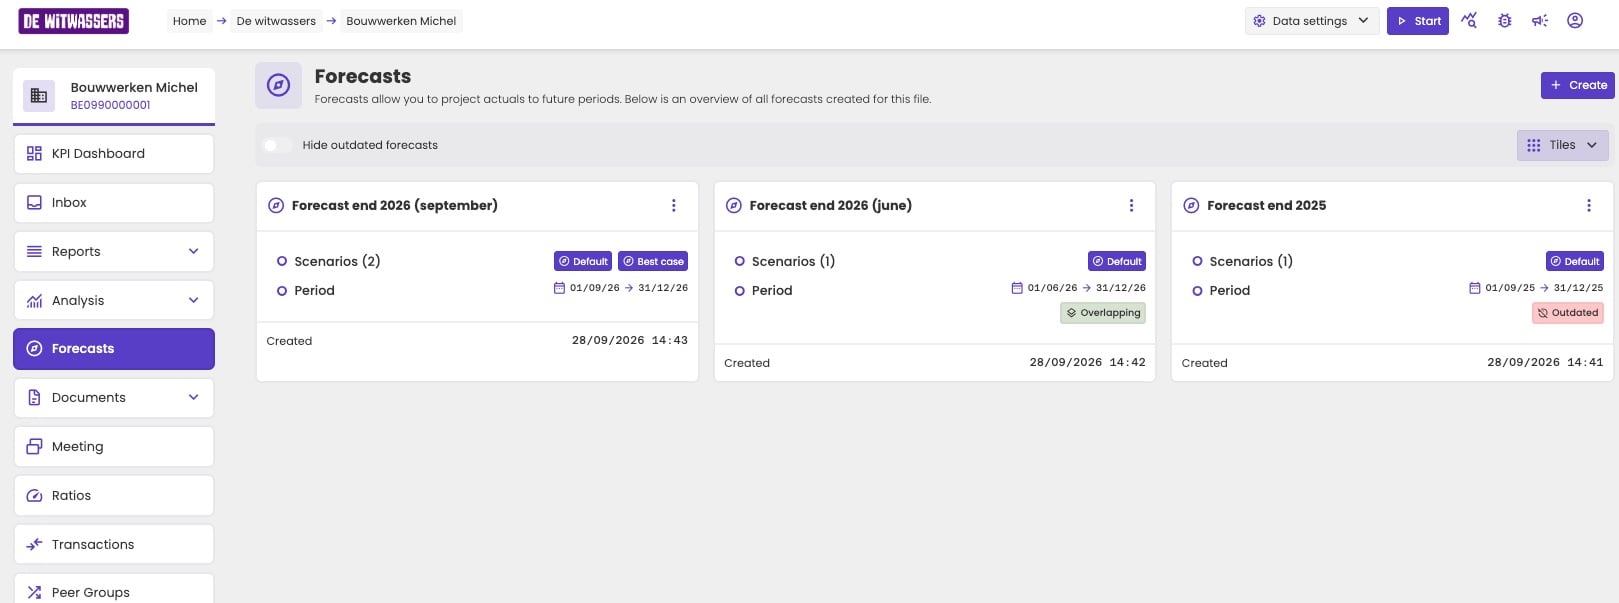
Three forecasts of the same administration.
The forecast editor
The editor shows the profit and loss with these columns: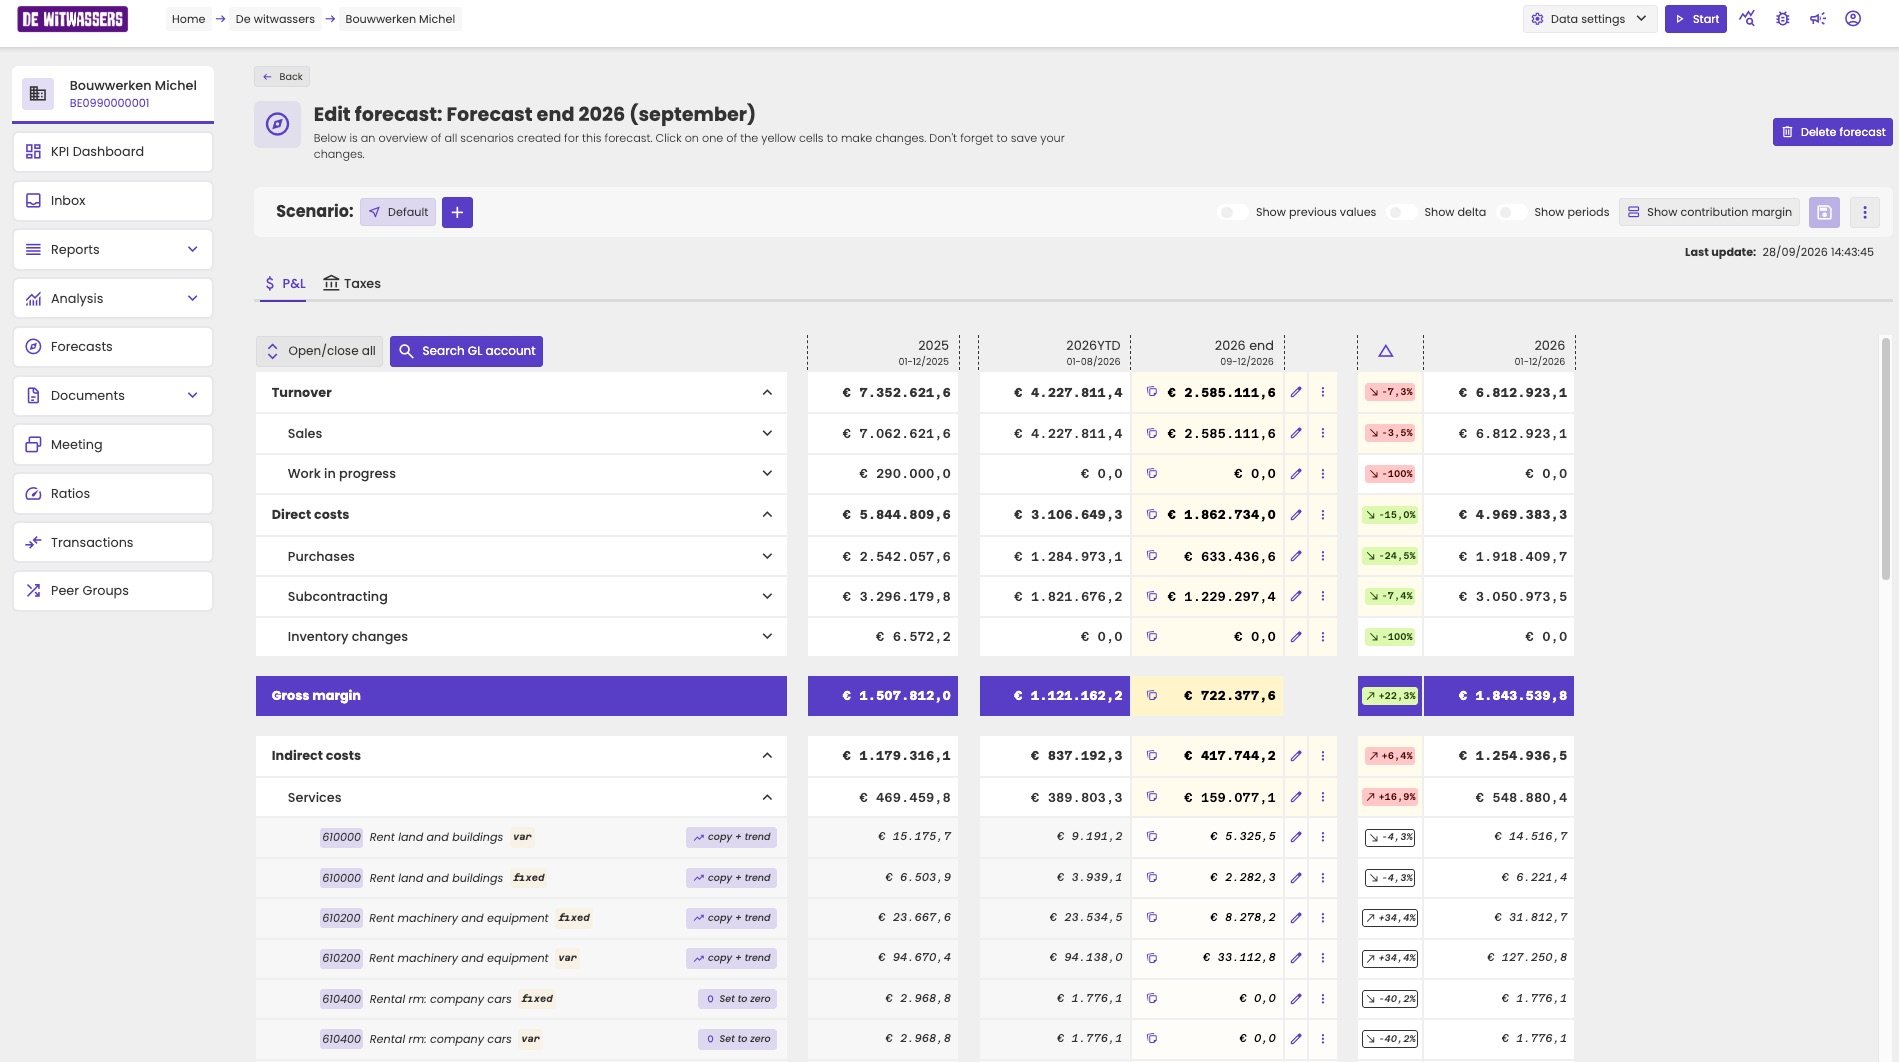
The forecast editor.
Show more detail
Three toggles at the top add information:- Show previous values shows the figure of the same period last year below each figure.
- Show delta adds the last 12 months and the 12 months before, with the change between them. aiGust uses this growth for the copy + trend method.
- Show periods shows each period of the year in a separate column. You can then change the forecast period by period.
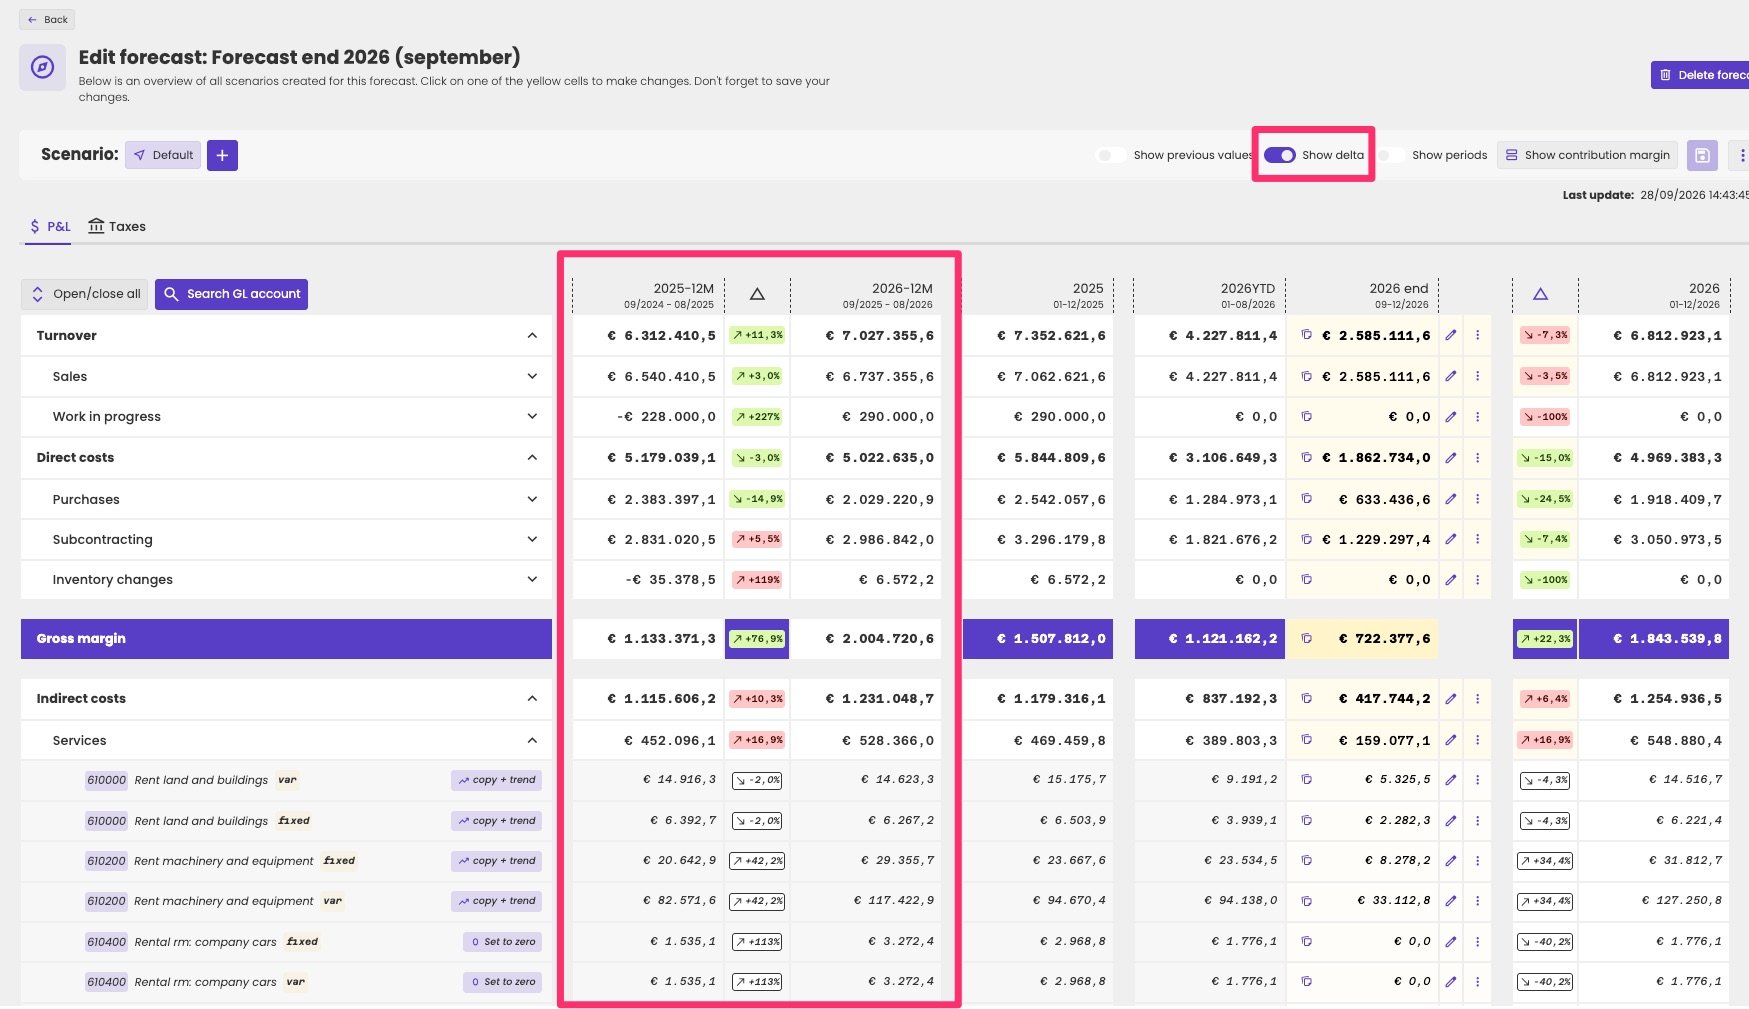
Show delta: the growth over the last 12 months, the basis of the automatic forecast.
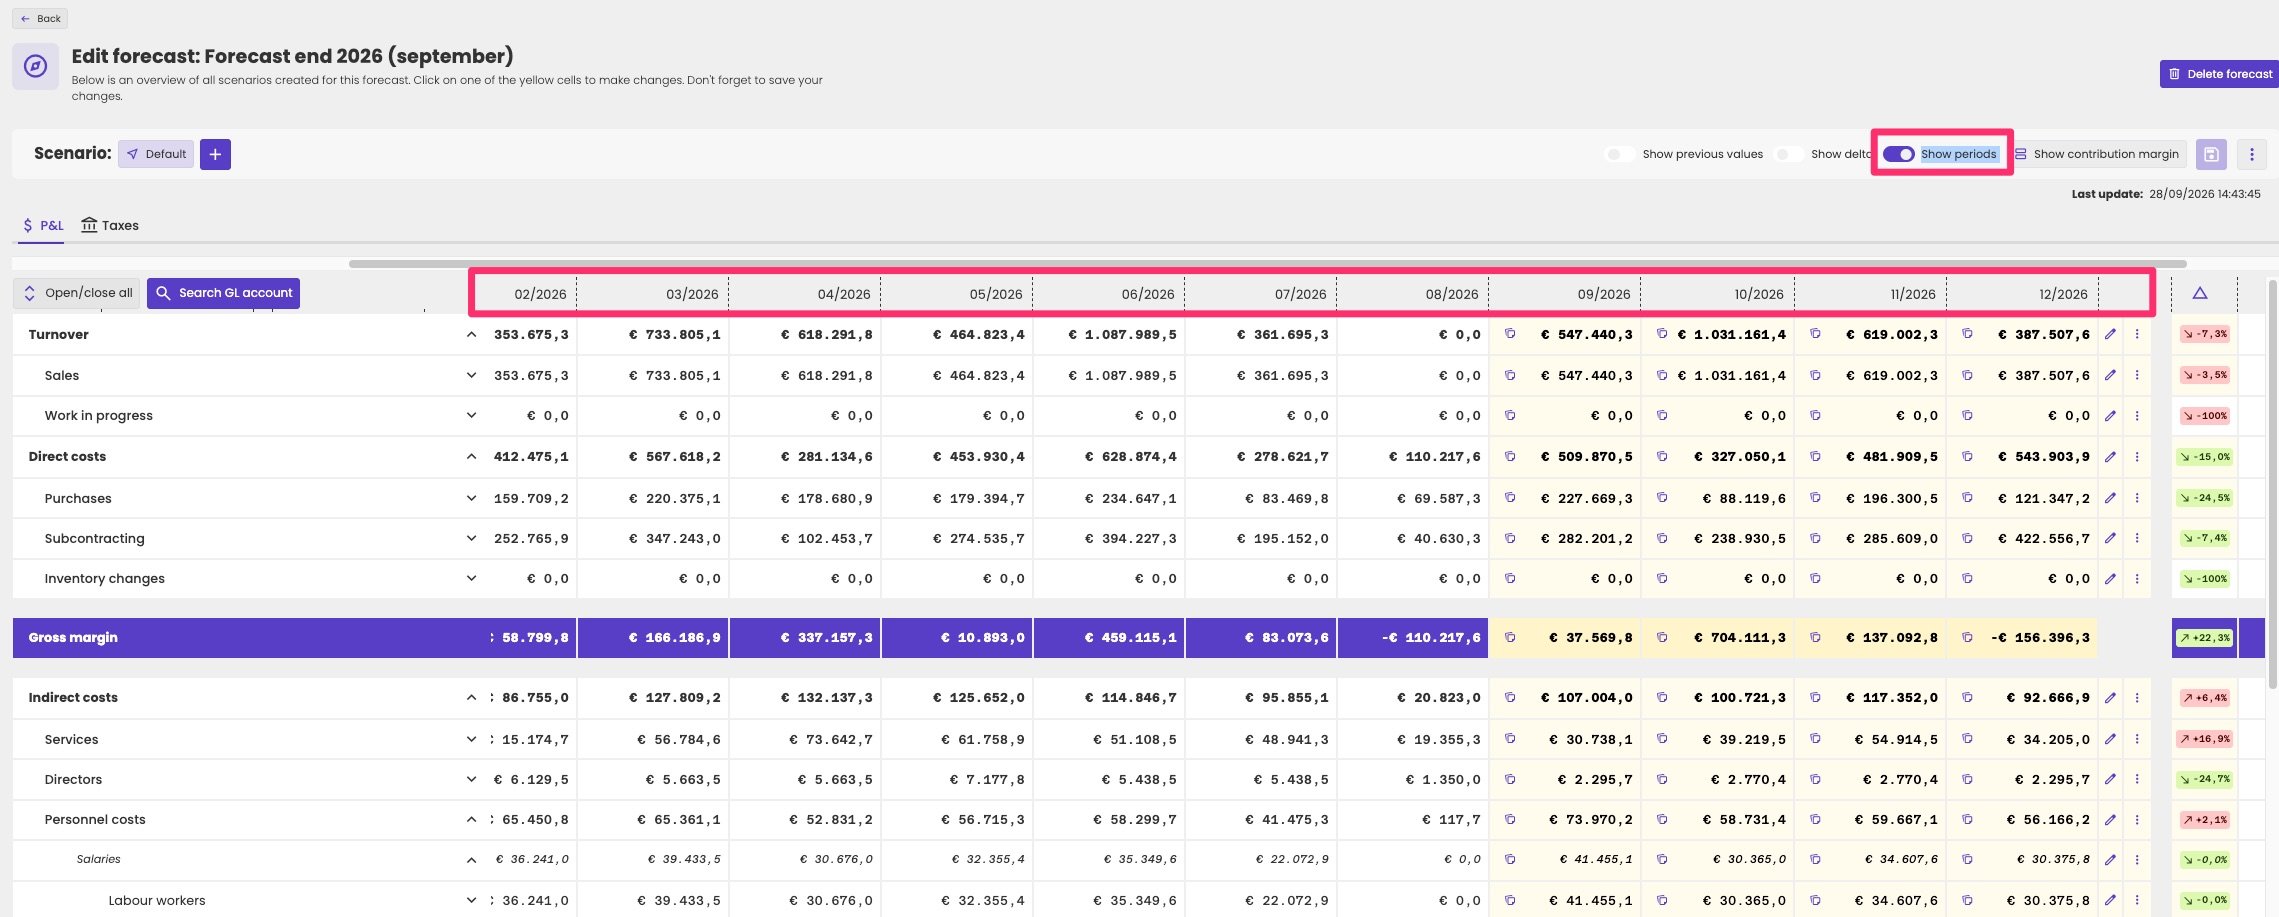
Show periods: one column per period.
Change the forecast
The editor recalculates everything immediately, like a large pivot table. aiGust always stores the forecast per account. A change on a higher level is translated to the accounts below it.Type a new amount
Click a yellow cell and type the new amount for the forecast period. Click the check mark to confirm. If you change a line on a higher level, for example turnover, aiGust spreads the change over the accounts below it and over the periods, in proportion to their current values.
Changing the forecast of the turnover.
Change the values per period
Click the pencil next to a figure to open Edit values. You see each period of last year next to the current year, and you can change the forecast periods. For an account with a trend, you can raise or lower the growth of each period with − and +. Click Submit to apply.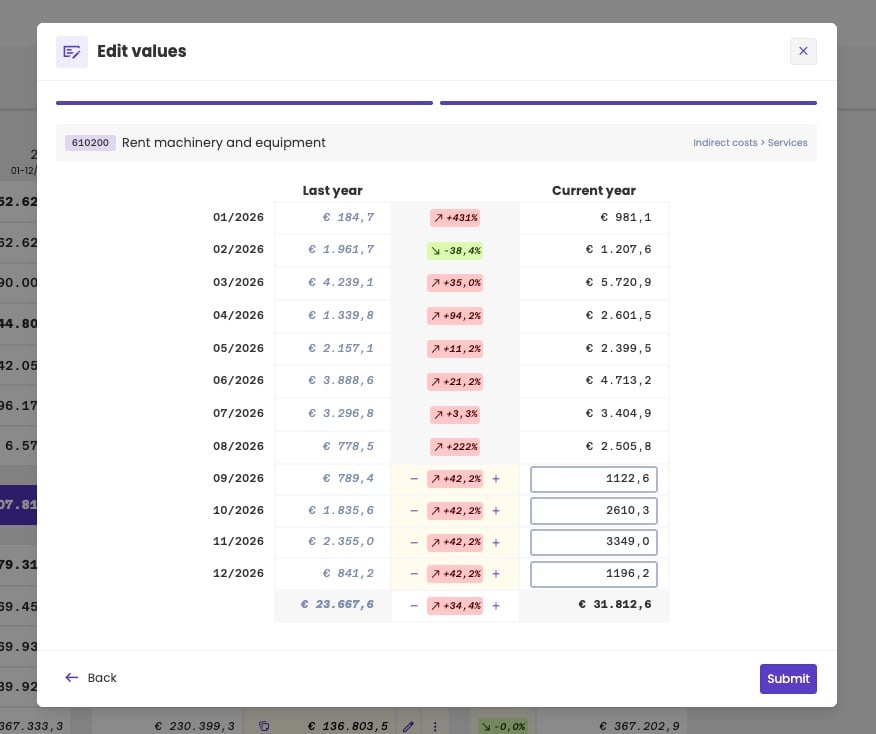
Edit values: the growth per period compared with last year.
Change the growth rate
Click the change (△) of a line to open Change growth rate. Enter the growth compared with last year, or change it with − and +, and click Confirm.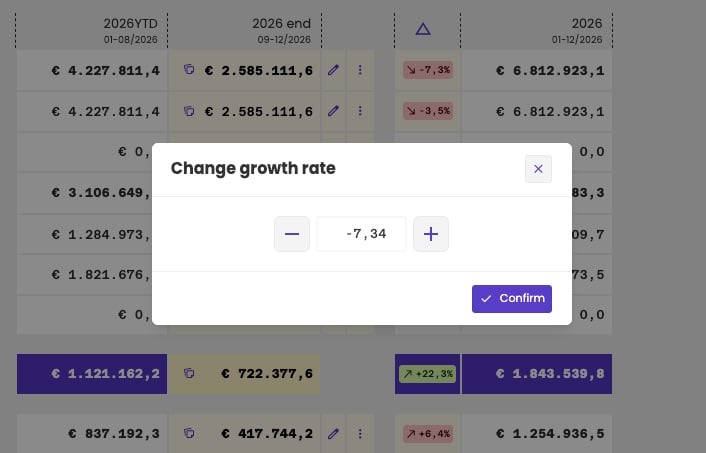
Setting the growth rate of a line.
Change the method of an account
Click the three dots next to an account and choose another method: Set to zero, Average last 12 months, Copy last value, copy or copy + trend. aiGust recalculates the account’s forecast.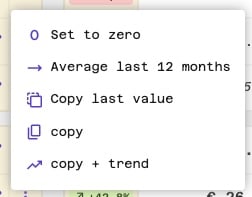
Choosing the forecast method of an account.
Forecast an account without history
To forecast an account that has no figures yet, for example a new rent contract, click Search GL account. Search for the account, select it, and click Next. Enter the amounts per period in Edit values, and click Submit.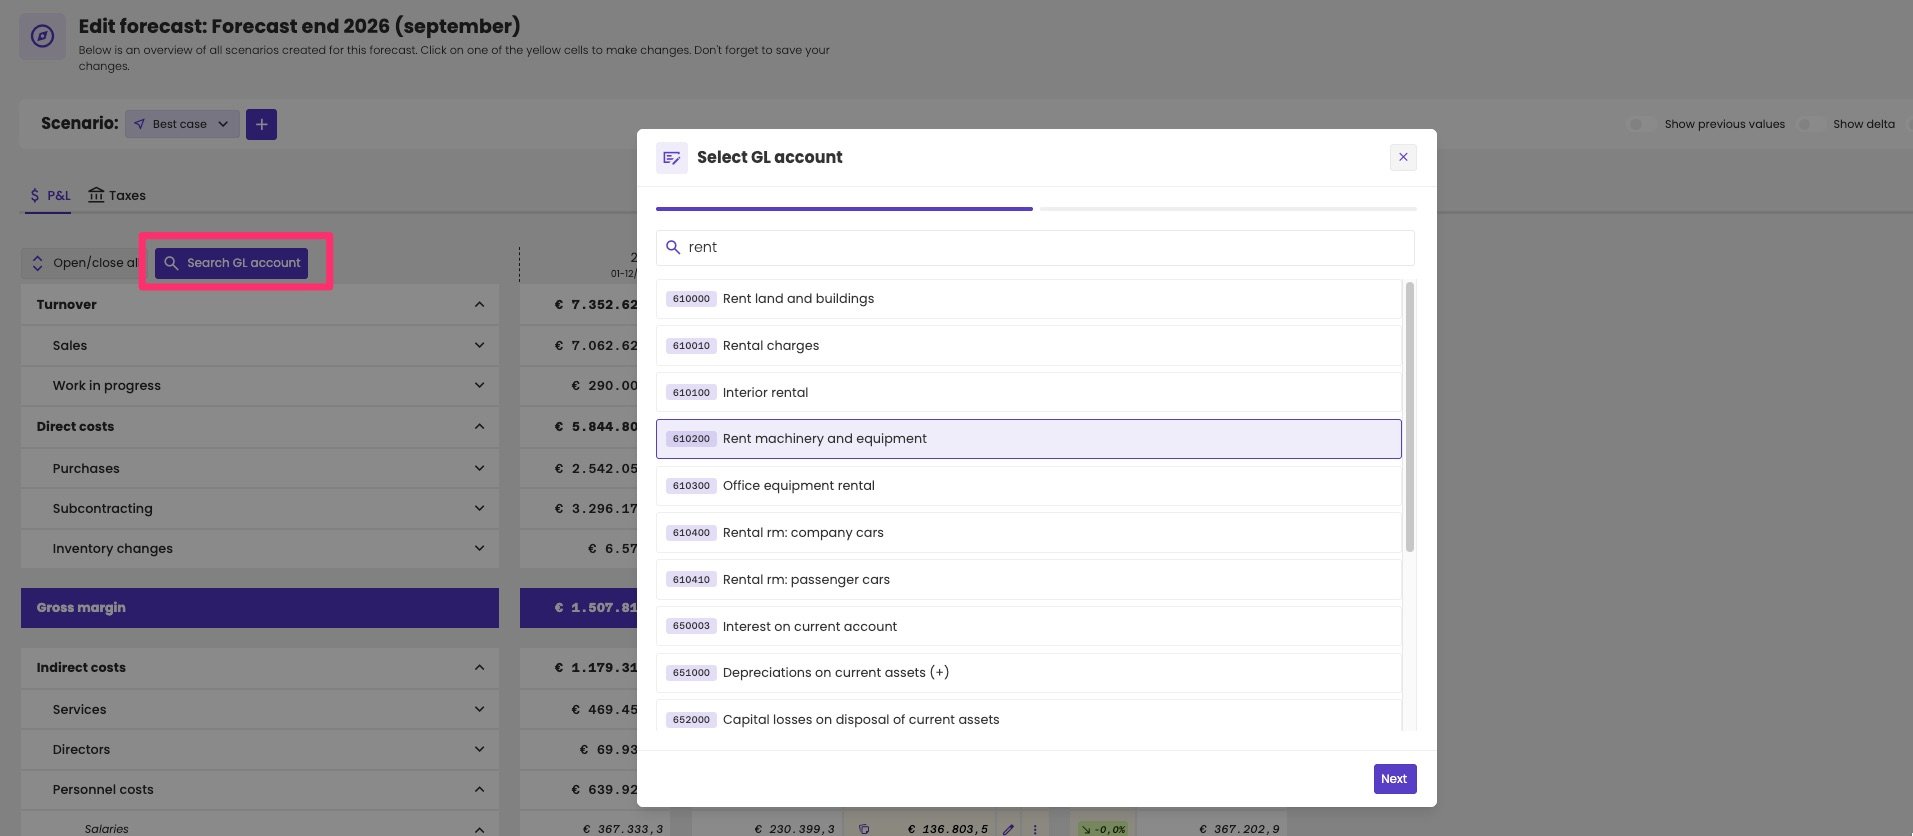
Search for the account to forecast.
Add a note
Add a note to a figure to explain an assumption, for example why you expect turnover to drop. Click the note icon to the left of a yellow cell, type the note, and click Save. Clear removes it. The note is only shown on that cell in the forecast editor. It doesn’t appear in the reports or the client portal.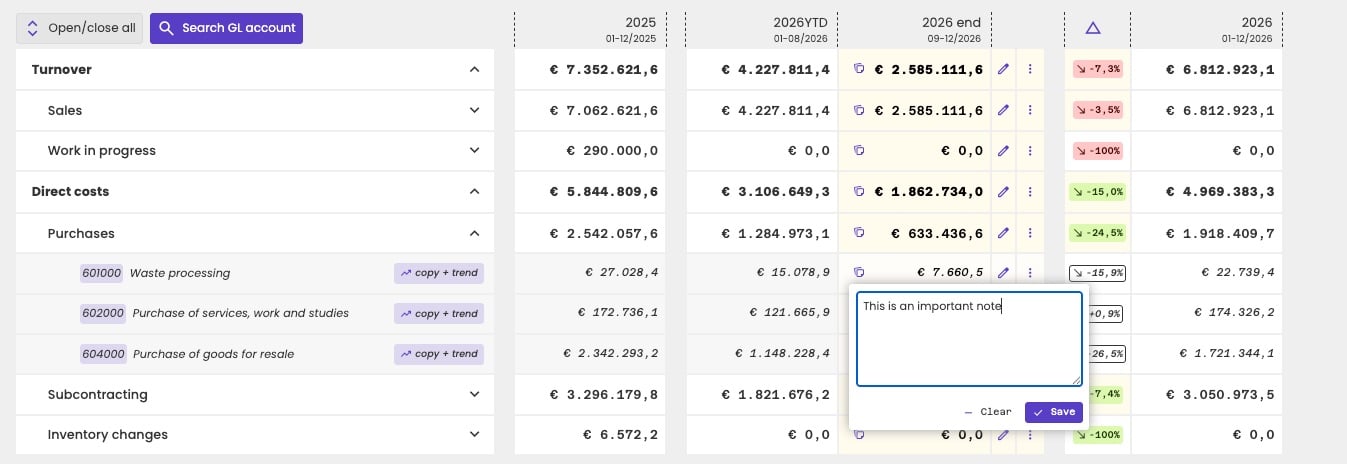
A note on a forecast figure.
Save and manage scenarios
Your changes aren’t saved automatically. Click the save icon at the top right, or use the three dots next to it:- Save scenario saves your changes in the current scenario.
- Save as new scenario saves your changes as a new scenario. Enter a name, for example Best case, and click Confirm.
- Delete scenario removes the current scenario.
- Edit name & description renames the scenario.
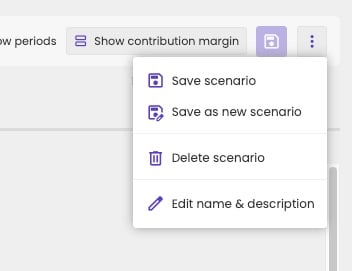
The options of a scenario.
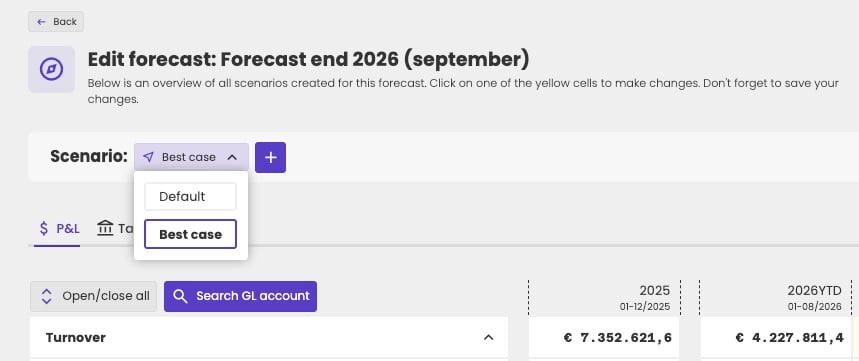
Switching between the scenarios of a forecast.