

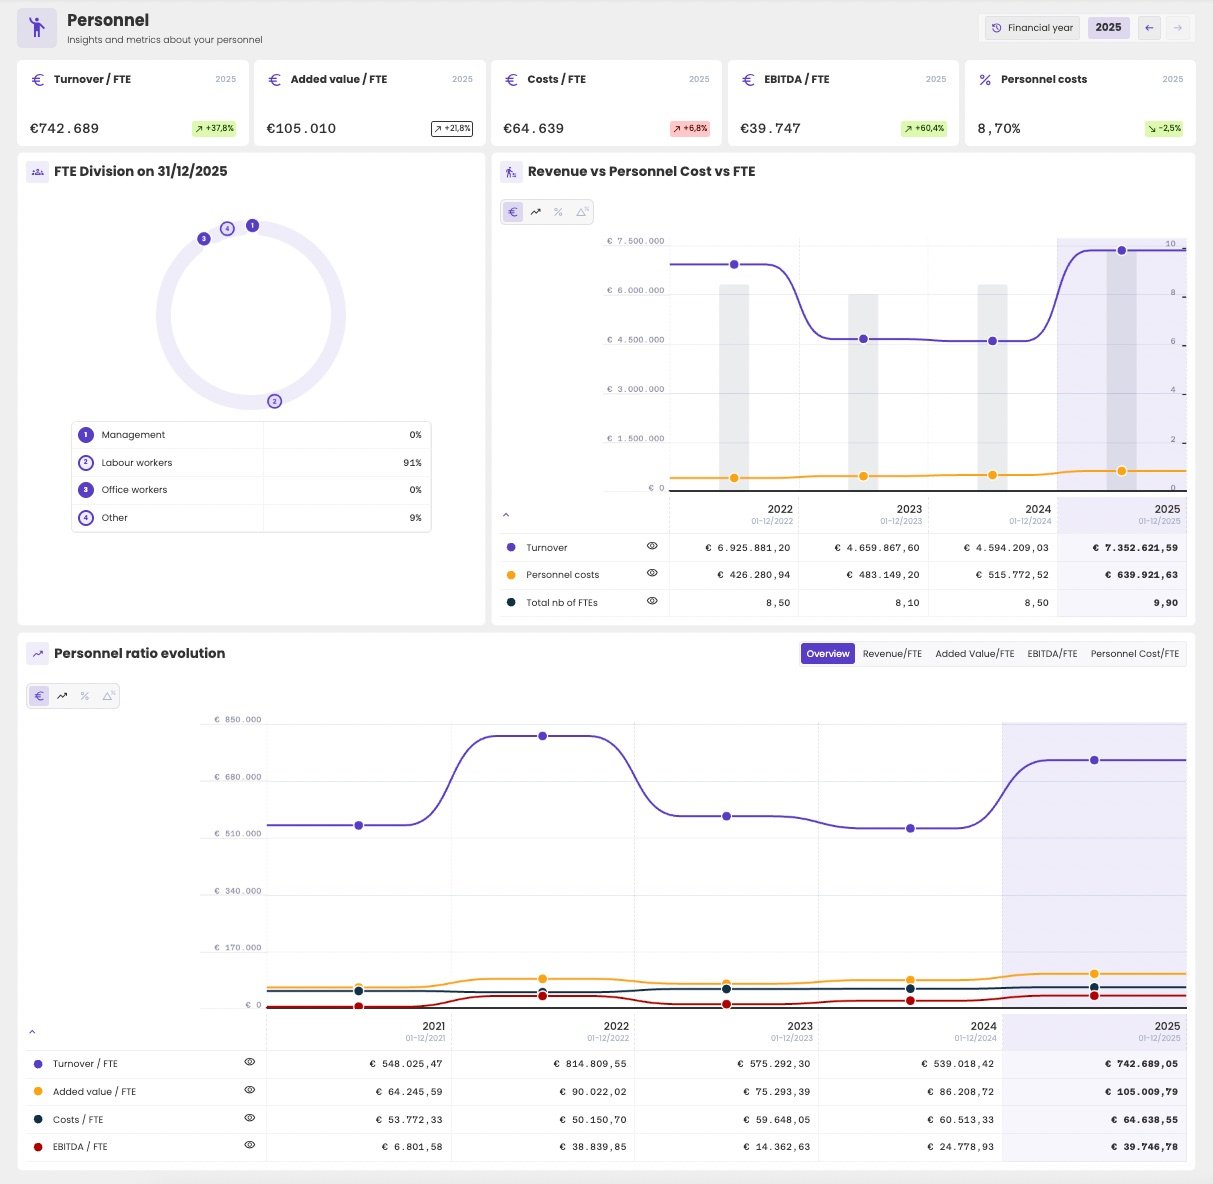
The personnel dashboard of an administration.
Choose the period
At the top right, choose the year with the arrows, or click it to pick another. Click the button next to it to switch between:- Financial year: full financial years.
- Quarterly figures: quarters. See Quarters.
- Per period: the financial periods of the administration.
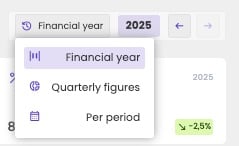
Switch between financial years, quarters and periods.
KPI cards
The cards at the top show the main personnel KPIs of the chosen year, with their change compared with the previous year:
A green badge means the change is good news, a red badge bad news. Rising costs per FTE, for example, show in red.
For the formulas, see Personnel KPIs and ratios.
FTE Division
How the staff is divided between Management, Labour workers, Office workers and Other, in FTE, on the closing date of the financial year. See FTE Division for the codes of the social balance sheet behind it.Revenue vs Personnel Cost vs FTE
Shows whether the staff and its cost grow in line with the business:- the bars show the number of FTEs, on the right axis;
- the lines show turnover and personnel costs, on the left axis.
Personnel ratio evolution
Shows how the ratios per FTE evolved over the years. Overview shows them all together. Click a tab to see one of them on its own: Revenue/FTE, Added Value/FTE, EBITDA/FTE or Personnel Cost/FTE.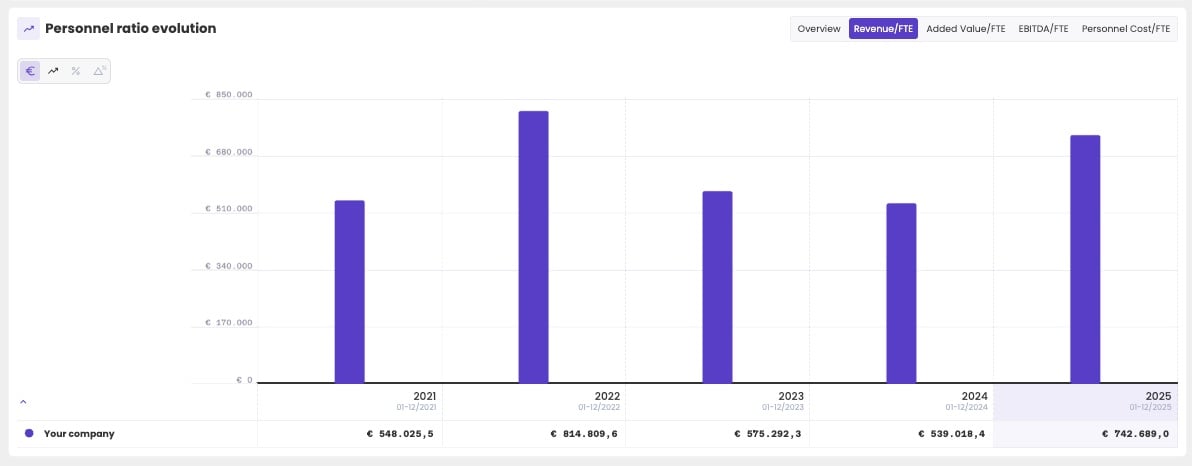
One ratio on its own: turnover per FTE.