

Select the peer group
Open the administration, click Data settings at the top of the page and expand Benchmark group. The list shows the administration’s default and custom peer groups. Select the one to compare with. All charts and KPI cards then use that peer group.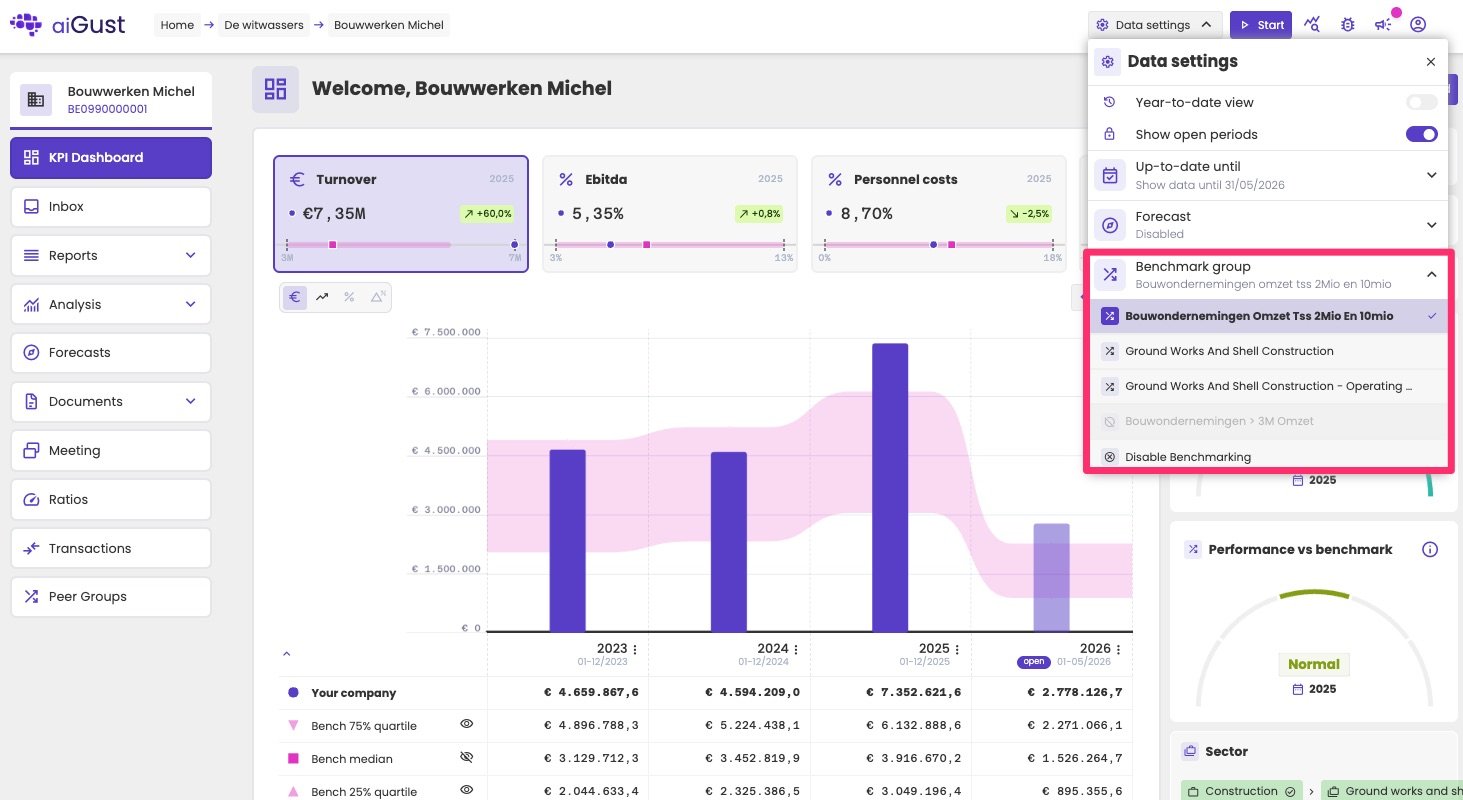
Selecting the peer group under Data settings. Inactive peer groups are greyed out.
- Inactive peer groups, for example with fewer than 10 peers, are greyed out and can’t be selected.
- To hide all benchmarks, for example when there’s no relevant peer group, select Disable Benchmarking.
Benchmarks in charts
Charts show the administration’s own figures together with the benchmark of its peer group.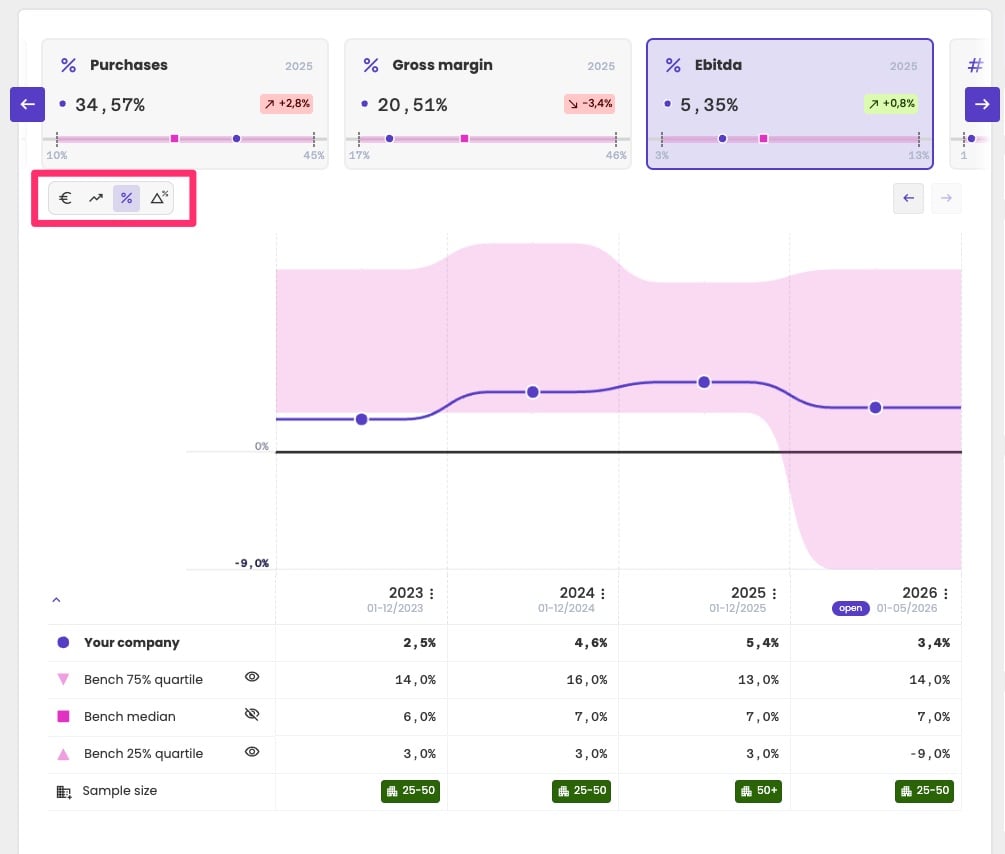
EBITDA as a percentage of turnover, with the band from Q25 to Q75 of the peer group behind it, and the table with the values below.
- Your own figures are shown in your firm’s main brand colour: as bars for absolute values, and as a line for percentages and margins.
- The benchmark is shown in your firm’s secondary brand colour, as a band from Q25 to Q75. The middle half of the peers falls inside the band.
- The median is hidden by default, to keep the chart readable.
The table below the chart
The table repeats the figures from the chart:
Click the eye icon next to a benchmark row to show or hide it in the chart. Showing the median adds it as a line. Hiding one of the quartiles removes the band.
Benchmarks in KPI cards
The KPI cards on the administration dashboard can show the benchmark as a small boxplot.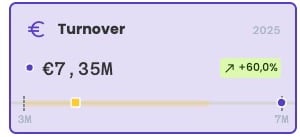
A KPI card with its benchmark: the band, the median (square) and the administration's own value (dot).
- The band runs from Q25 to Q75 of the peer group.
- The square marks the median.
- The dot marks the administration’s own value.
Performance vs benchmark
The Performance vs benchmark widget sums up in one score how the administration performed compared with its default peer group. See Performance scores.Related pages
How benchmarking works
Quartiles, privacy and choosing the right KPI type.
Create peer groups
Use aiGust’s peer groups or define your own.