

Activate a forecast
- Open the administration, and click Data settings at the top of the page.
- Open Forecast.
- Under Forecast, choose the forecast. Under Scenario, choose the scenario.
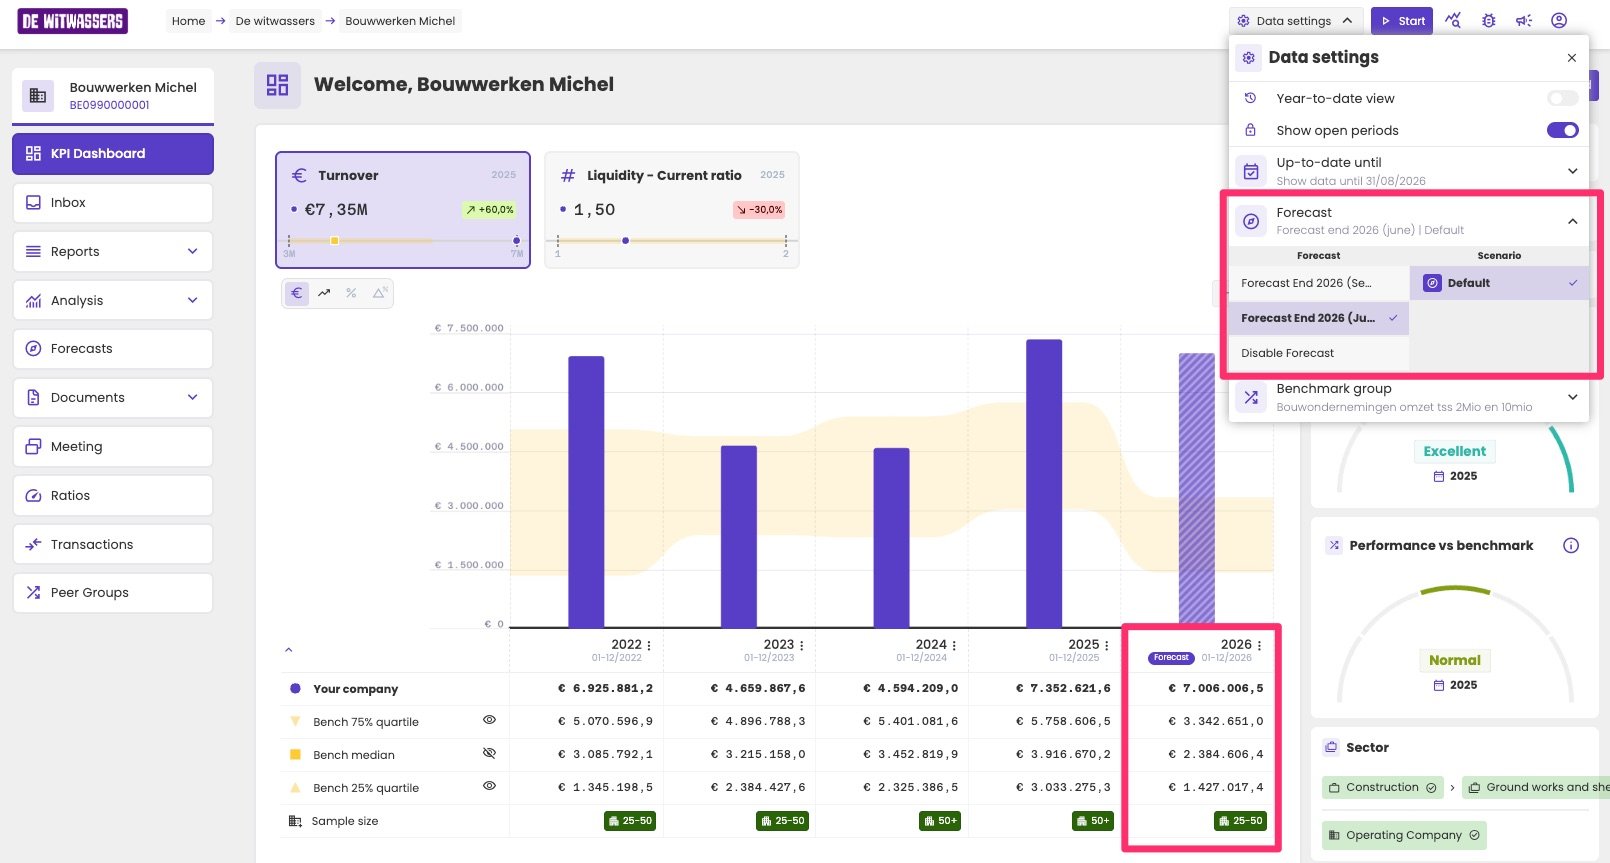
Choosing the forecast and scenario in the data settings.
- the administration dashboard and its charts
- the financial reports, such as the profit and loss
How forecast figures are marked
- In charts, the bar of the year with a forecast is hatched.
- In the table below a chart, the column has a Forecast badge.
- In the financial reports, the column has a FCST badge.
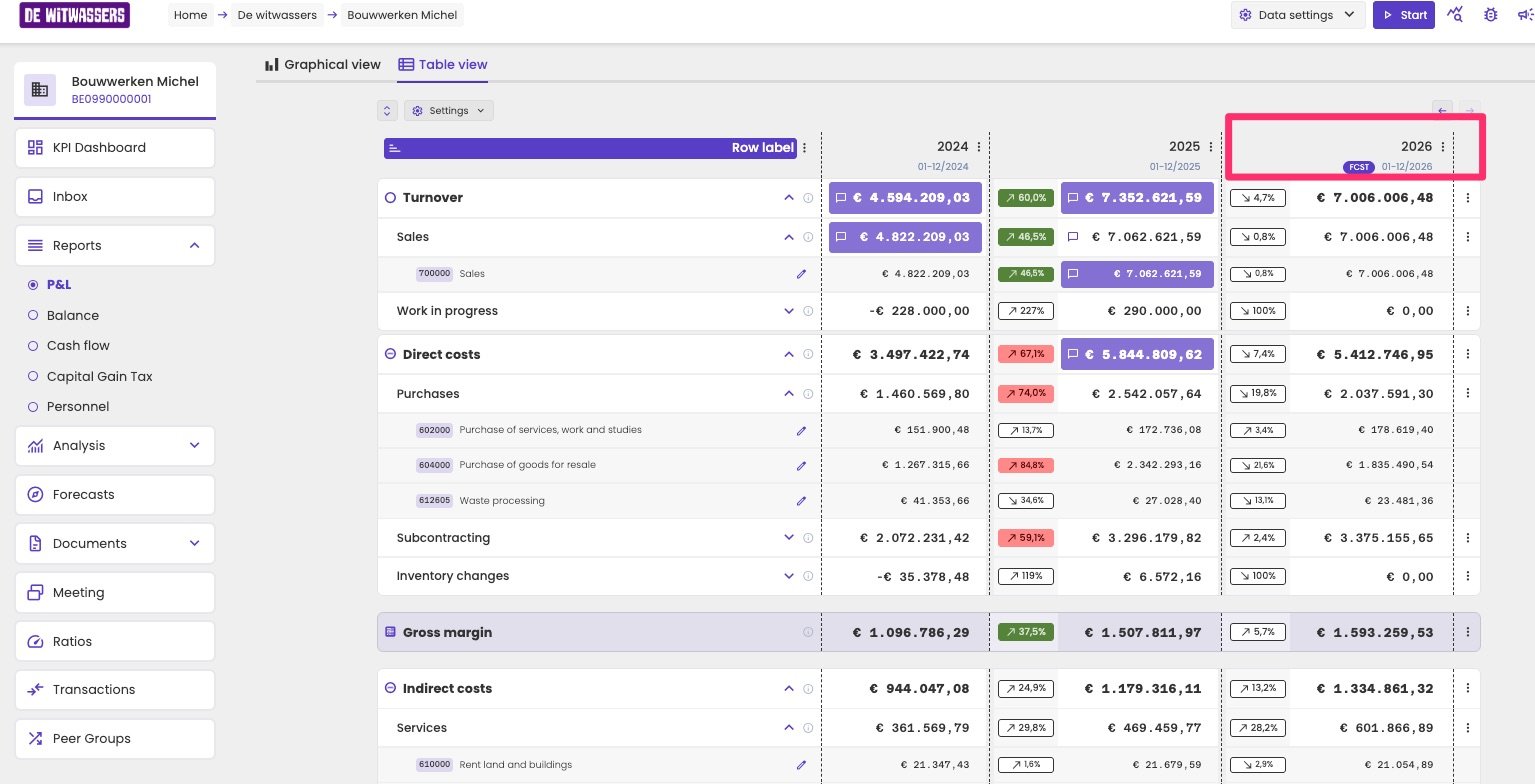
The profit and loss with a forecast for 2026.
Forecasts in meetings and the client portal
- In meetings, you can use the forecast to discuss the expected result with your client.
- In the client portal, your client sees an activated forecast, but can’t change it or switch it off.
What forecasts aren’t used for
- Benchmarks are always calculated on actual figures, never on forecasts.
- Actual vs budget comparisons aren’t available.