

Financial year or year to date
- Financial year view, the default: each column is a full financial year.
- Year-to-date view: each column is the same stretch of time in a different year. The columns are called 2024YTD, 2025YTD and so on. That lets you compare the open year so far with the same months in earlier years.
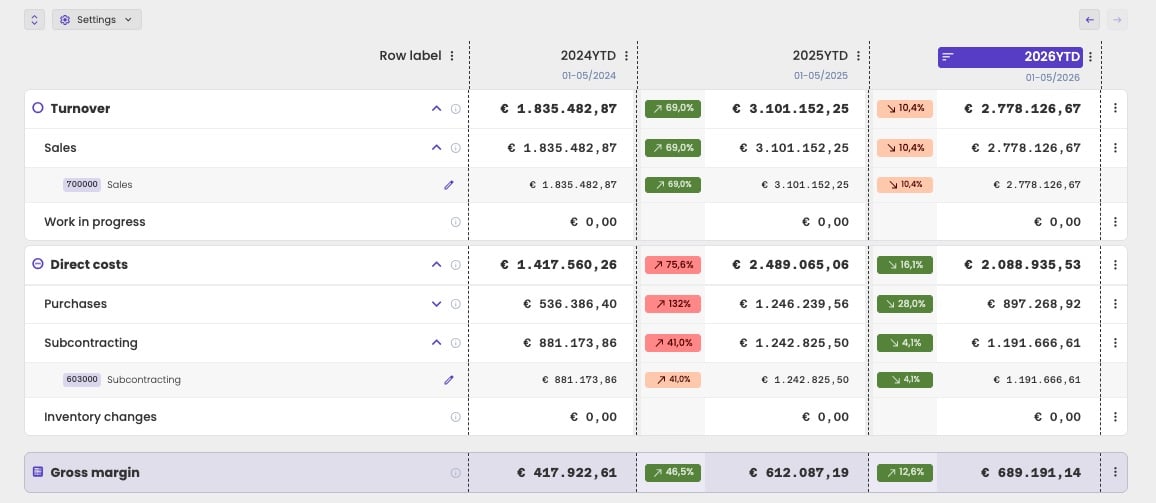
Year-to-date view: January to May of 2024, 2025 and 2026.
Show the open financial year
In the financial year view, Show open periods adds a column for the open financial year, up to the up-to-date-until date. The column is marked Open. For an administration with a financial year ending on 31 December and an up-to-date-until date of 31 May 2026, that column covers 01-05/2026.Where you set them
You can switch both settings in two places:- Under Settings, above the table, as Year-to-date view and Show open periods.
- Under Data settings, at the top of the page. These settings apply to every report and chart of the administration, so you always know which view you’re looking at.
Quarters and periods
To see a financial year in more detail, click the three dots on its column header and choose Show quarters or Show periods. The columns then show 2025 Q1, 2025 Q2 and so on, grouped under the financial year, as many as fit on the screen. Use the arrows above the table to scroll.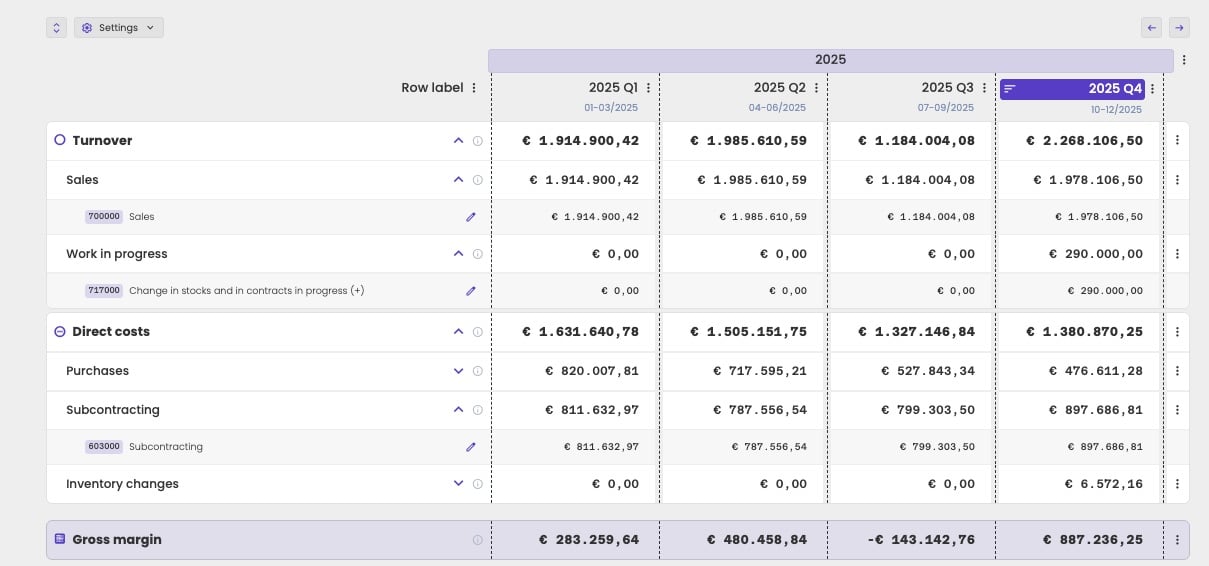
Financial year 2025 split into quarters.
Move between years, or back to the year view
In the quarter or period view, click the three dots next to the financial year above the quarters:- Next year or Previous year shows the quarters of another financial year.
- Go back to year view returns to the financial year columns.
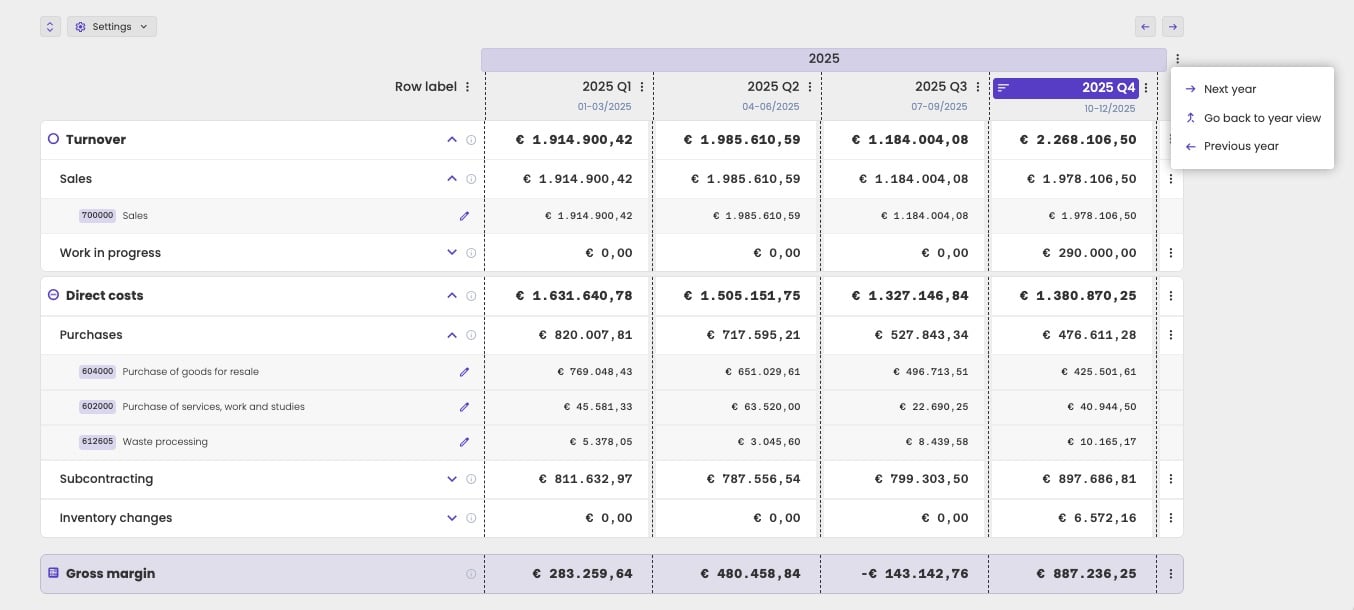
The options of the financial year above the quarters.
Compare quarters
With Horizontal analysis on, each quarter is compared with the same stretch of time one year earlier, not with the previous quarter. 2025 Q2 is compared with 2024 Q2, for example. The comparison column is shown in italics next to it. N/A means the line has no value in that period.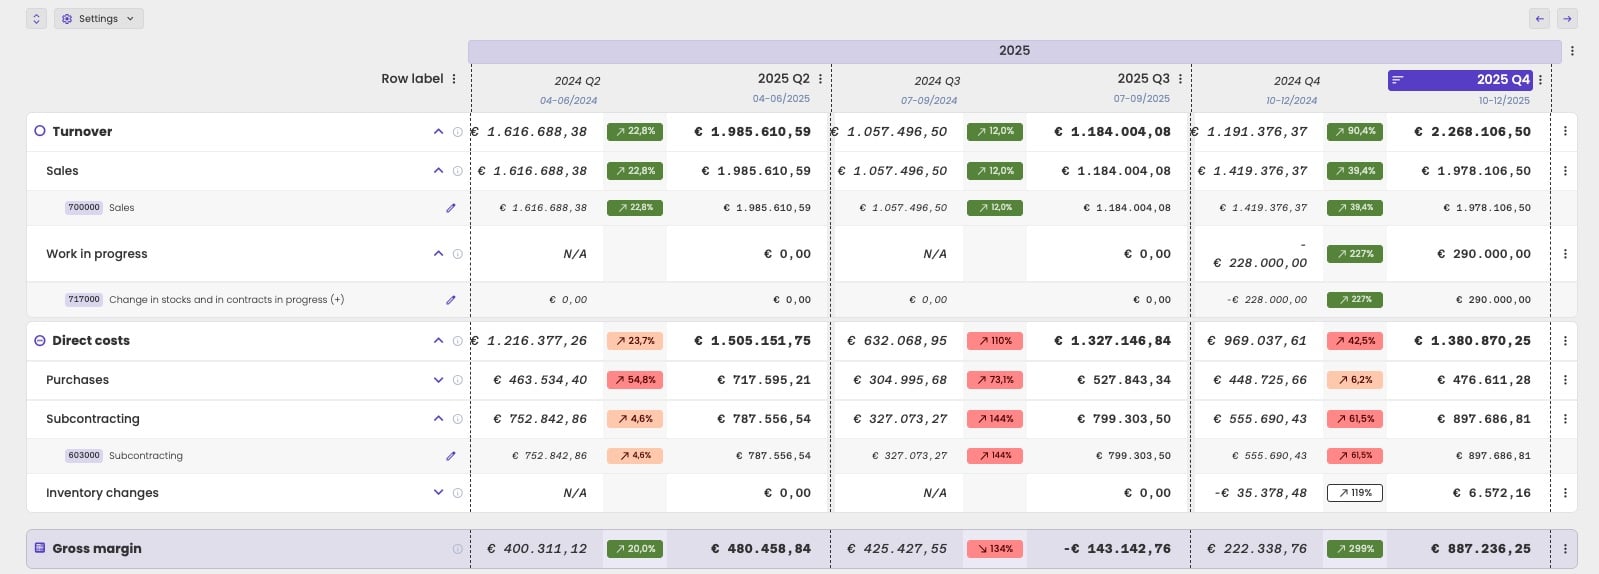
Quarters compared with the same quarter one year earlier.
Why quarters or periods are sometimes unavailable
aiGust builds quarters and periods from the periods it receives from the data source. If an administration only has one period per financial year, the options are greyed out. aiGust doesn’t spread a year’s figures over quarters. This is common for administrations that only come from a compliance connector, such as Silverfin or Adsolut fiscal files:- Compliance files often have a single period per year, because firms reconcile them only once a year.
- Some have unusual periods, for example of 4 or 8 months, which don’t form quarters.