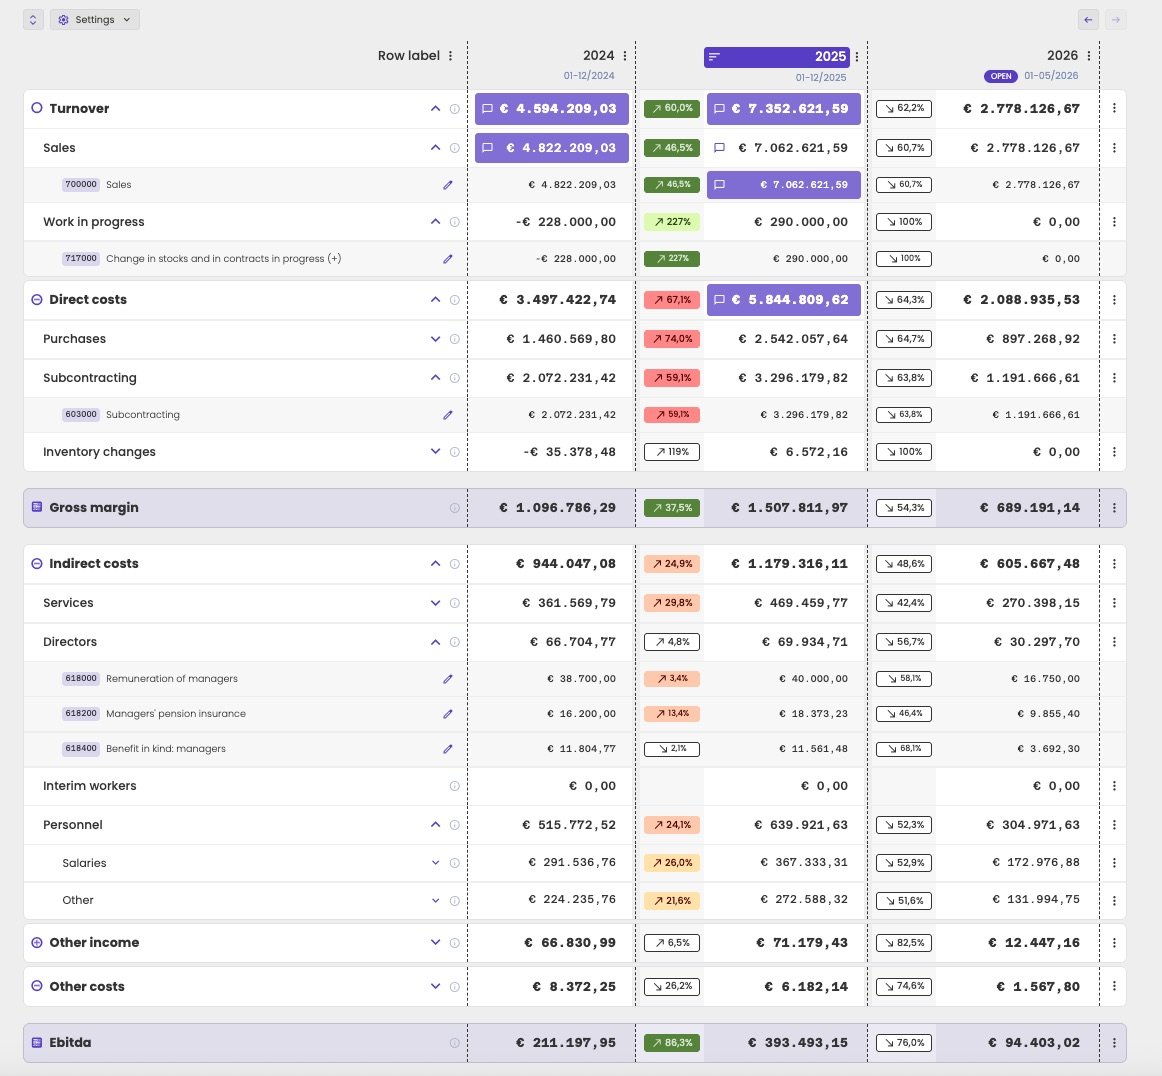
The profit and loss, balance sheet and cash flow all show their figures in the same financial table. Each report has two tabs: Table view, described on this page, and Graphical view. See Waterfall chart and Balance sheet visual.
Profit and loss table with columns 2024, 2025 and the open year 2026, coloured badges with the change between years, expanded lines down to accounts such as 700000 Sales, and highlighted cells with comments

The profit and loss in table view, with horizontal analysis and notifications on.

Settings

Click Settings above the table to change what it shows.
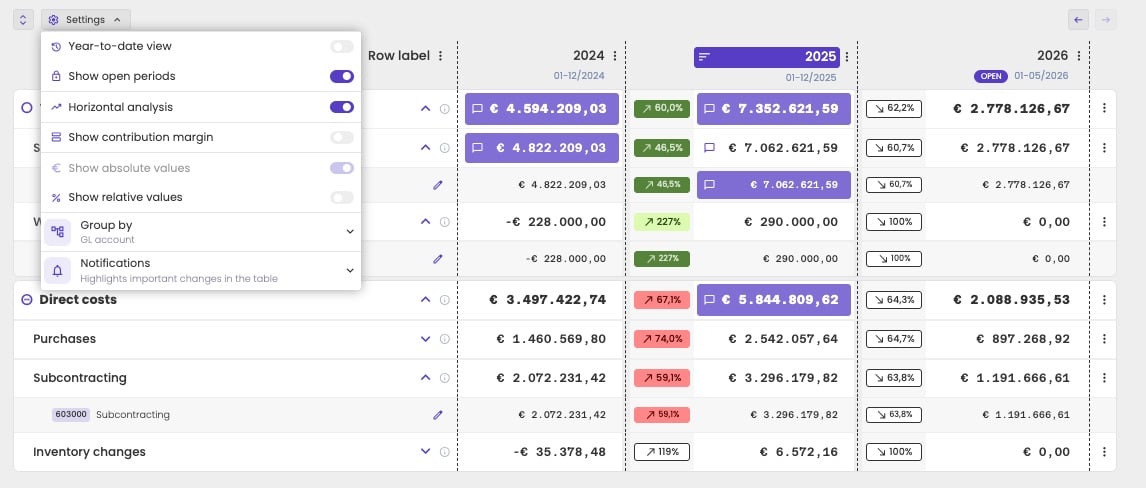
Settings menu with Year-to-date view, Show open periods, Horizontal analysis, Show contribution margin, Show absolute values, Show relative values, Group by and Notifications

The settings of the profit and loss.

Work with rows

Click the arrow next to a line to open or close the lines below it. The lowest level shows the individual accounts, business partners or labels. Click the three dots at the end of a row for more options for that row only:
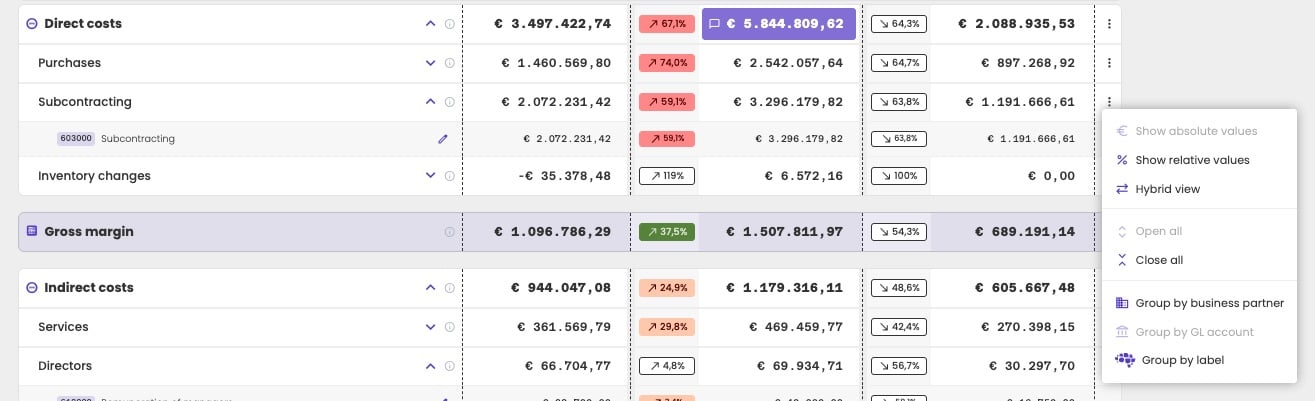
Row menu with Show absolute values, Show relative values, Hybrid view, Open all, Close all, Group by business partner, Group by GL account and Group by label

The options of a row.

  • Show absolute values, Show relative values or Hybrid view (both) for that row.
  • Open all or Close all lines below it.
  • Group by business partner, Group by GL account or Group by label for the lines below it.

Detail level

With Group by in the settings, or per row, you choose what the lowest level shows:
  • GL account: the accounts as booked in the administration’s bookkeeping.
  • Label: the accounts translated to the aiGust chart of accounts.
  • Business partner: the customers or suppliers behind the figures.
Grouping by business partner shows which customers or suppliers make up a section, for example the five suppliers behind most of your services and other goods. Most bookkeeping software doesn’t offer that view.

Change the label of an account

At account level, click the pencil next to an account to open Manage label. There you can check or change the label of the account, without going to the Mapping tab.
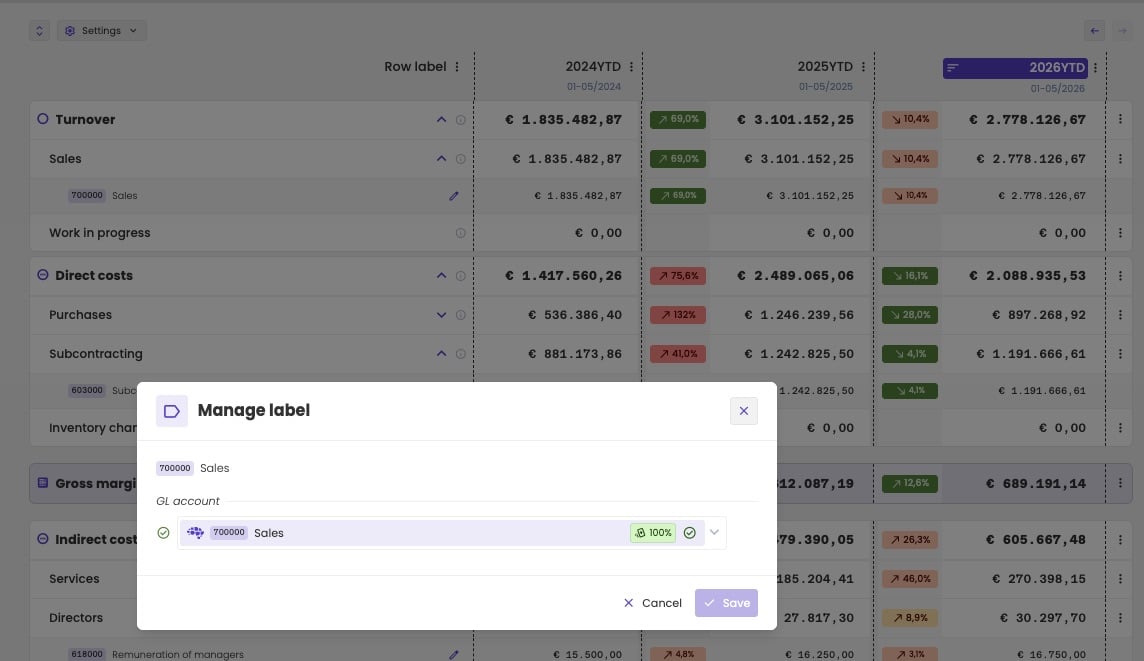
Manage label dialog for account 700000 Sales, showing its label 700000 Sales with 100% certainty, and Cancel and Save buttons

Changing the label of an account from the report.

Notifications

With Notifications on, aiGust colours the badges of the horizontal analysis to draw your attention to the changes that matter. The colours range from dark green through light green to orange and red. A white badge means the change isn’t important. The colour depends on two things:
  • How large the line is compared with the total. A cost of 0.1% of turnover doesn’t matter much, even if it doubles.
  • How large the change is. An increase of 100% matters more than one of 1%.
Click a figure to see its notification on the Details tab of the cell details. There you can acknowledge it, or mark it as a false alert. The Benchmark tab shows a second notification: how the figure compares with the peer group. To stop the notifications for a line, turn off Alerts in the cell details. aiGust sets default sensitivities for the colours. Your key users can adjust them for your firm. See KPI sensitivity. This colour coding is separate from triggers and alerts.

Sort the table

Click the three dots on a column header to sort by that column: Sort descending or Sort ascending. In aiGust, three dots always mean there’s more you can do.
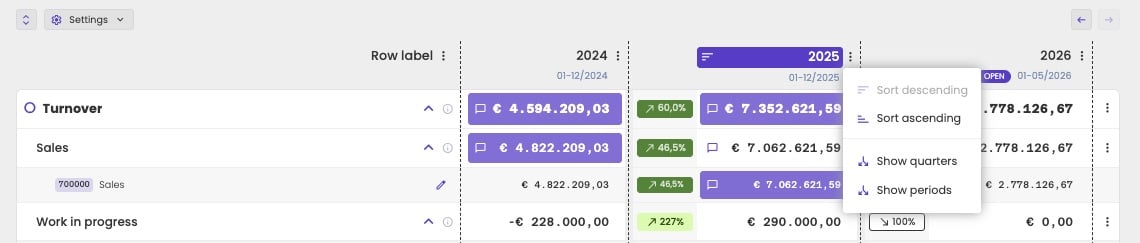
Column menu of 2025 with Sort descending, Sort ascending, Show quarters and Show periods

The options of a column: sorting, and drilling down into quarters or periods.

Sorting only changes the order of the rows at the lowest level. The structure of the report stays the same: turnover stays at the top, and the gross margin stays below turnover and direct costs. The sorted column is highlighted in the header.

View settings

A few settings change how every report looks, such as the column order and compact notation. Your firm sets the defaults, and you can override them for yourself. See Firm-wide report view settings.