The profit and loss and the cash flow both have a Graphical view tab. It shows the report as a waterfall: step by step, how you get from the first line to the last, and where the biggest effects are.

Read the profit and loss waterfall
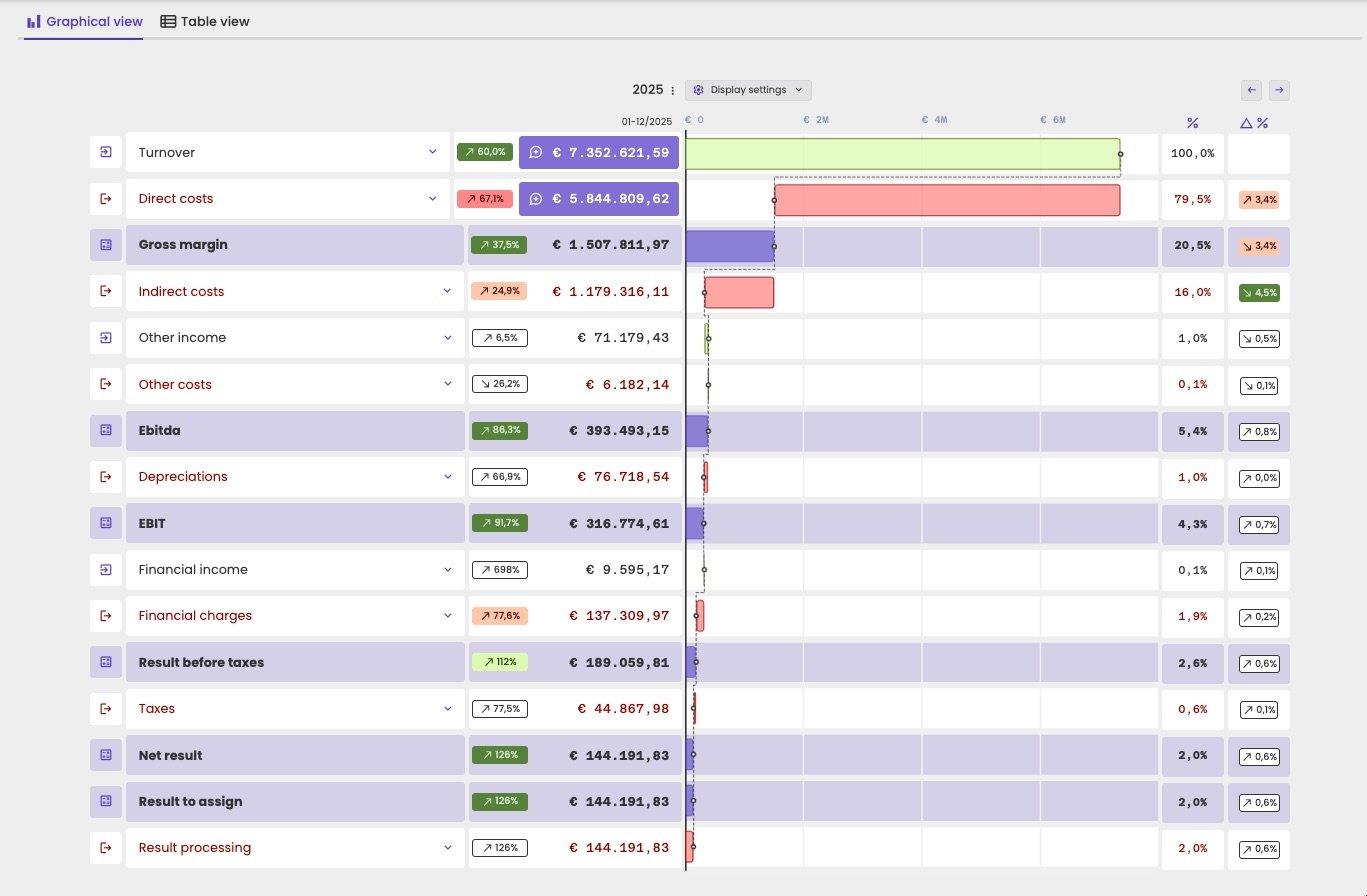
Graphical view of the profit and loss for 2025, with a row per line from turnover to result processing; each row shows the change badge, the amount, a bar in the waterfall, the percentage of turnover and the change in percentage points

The profit and loss of 2025 as a waterfall.

Each row shows one line of the profit and loss:
  • The change compared with the previous year, as a badge
  • The amount
  • A bar in the waterfall. Income is green and goes to the right, costs are red and go to the left. Subtotals such as gross margin and EBITDA are shown in your firm’s brand colour.
  • %: the line as a percentage of turnover
  • Δ %: the change in that percentage compared with the previous year, in percentage points
Each bar starts where the previous one ended, so you see at a glance which costs weigh most on the result.

Read the cash flow waterfall

The cash flow waterfall shows how the cash at the start of the period turned into the cash at the end. A sentence at the top sums it up, for example: On 31/12/2025, Bouwwerken Michel had €264,376.41 on their bank account. On 31/05/2026, this was €70,055.11. This is a decrease of €194,321.30.
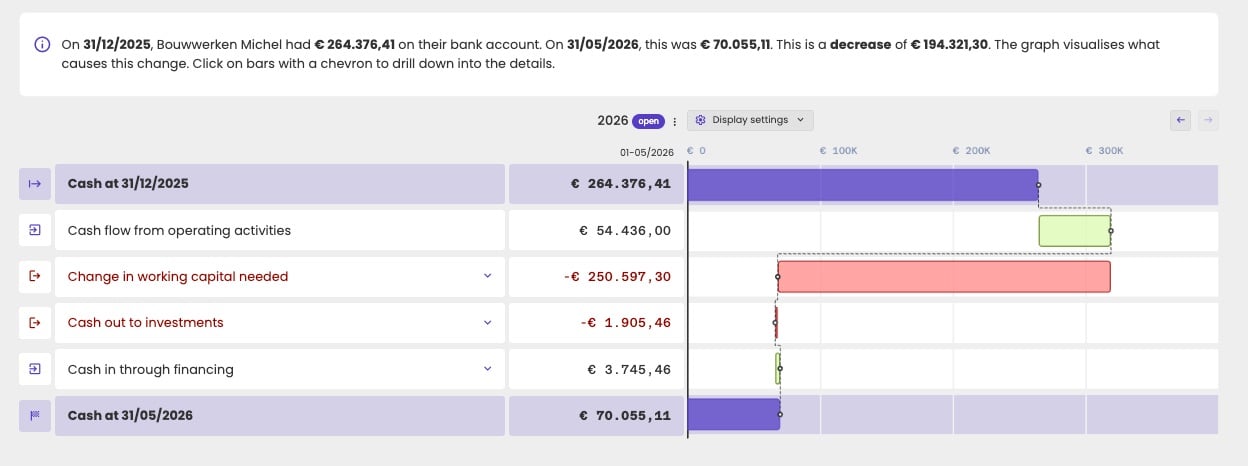
Graphical view of the cash flow from cash at 31/12/2025 to cash at 31/05/2026, with the cash flow from operating activities, the change in working capital needed, cash out to investments and cash in through financing in between

The cash flow of the open year as a waterfall.

  1. Cash at the start of the period
  2. Cash flow from operating activities
  3. Change in working capital needed
  4. Cash out to investments
  5. Cash in through financing
  6. Cash at the end of the period
It shows why a profit doesn’t necessarily mean that cash grew by the same amount, for example because customers paid later. See Cash flow definition.

Drill down

Click a line with an arrow to see what it’s made of. The chart then shows the lines below it, with a path at the top, for example Start › Indirect costs › Services. Click Back, or a step in the path, to go back up.
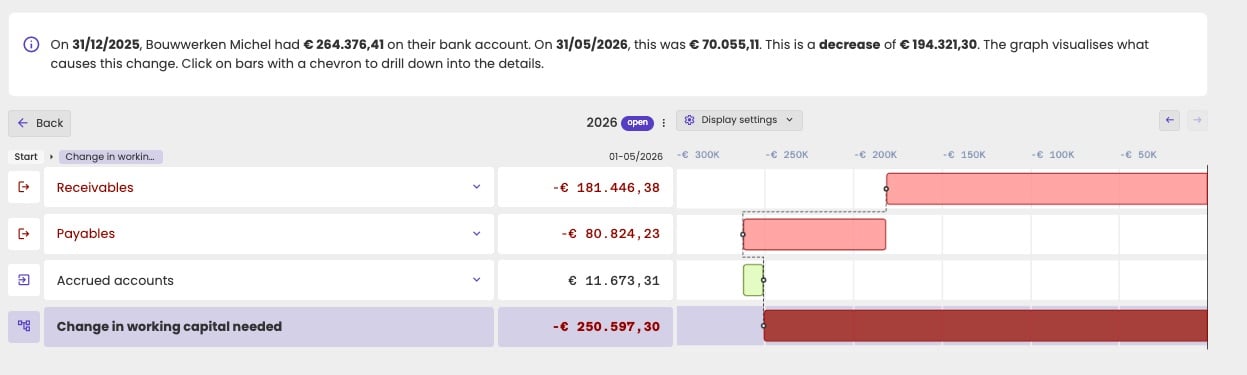
Cash flow waterfall drilled down into change in working capital needed, showing receivables, payables and accrued accounts, with a Back button and the path Start, Change in working capital

The change in working capital needed, split into receivables, payables and accrued accounts.
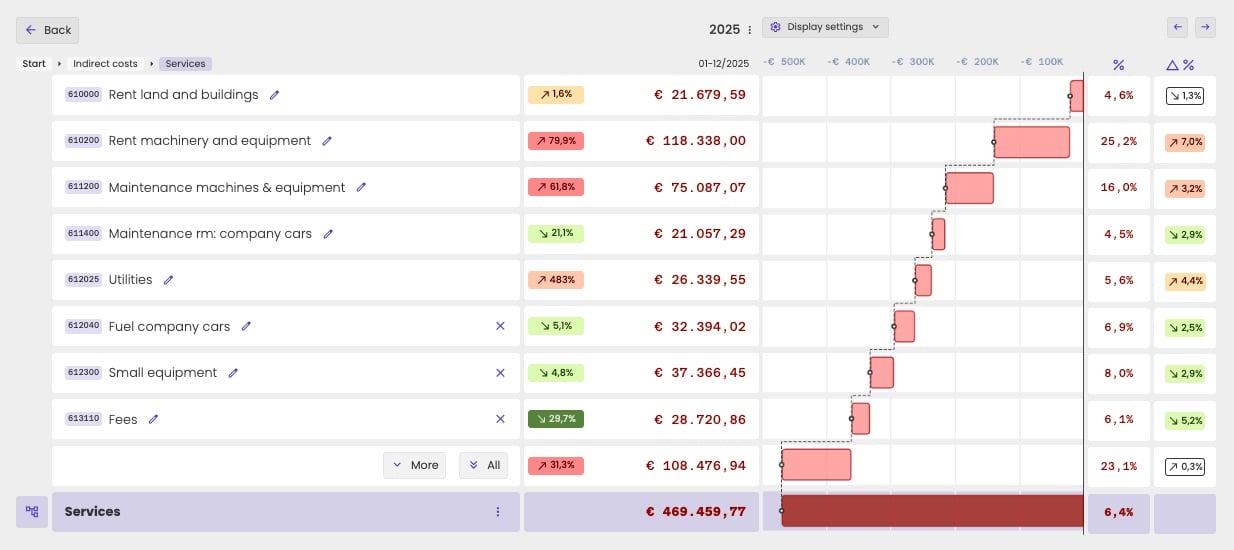
At account level, the chart shows the largest accounts. Click More to show more accounts, or All to show them all.
Profit and loss waterfall drilled down to Indirect costs, Services, showing accounts such as 610200 Rent machinery and equipment and 612040 Fuel company cars, with More and All buttons for the remaining accounts

The services, drilled down to account level.

Individual figures have the same cell details as in the table: transactions, contributors, evolution and comments.

Switch years and change the display

Switch years with the arrows at the top right. The waterfall always shows one year at a time. Display settings, next to the year, has these options:
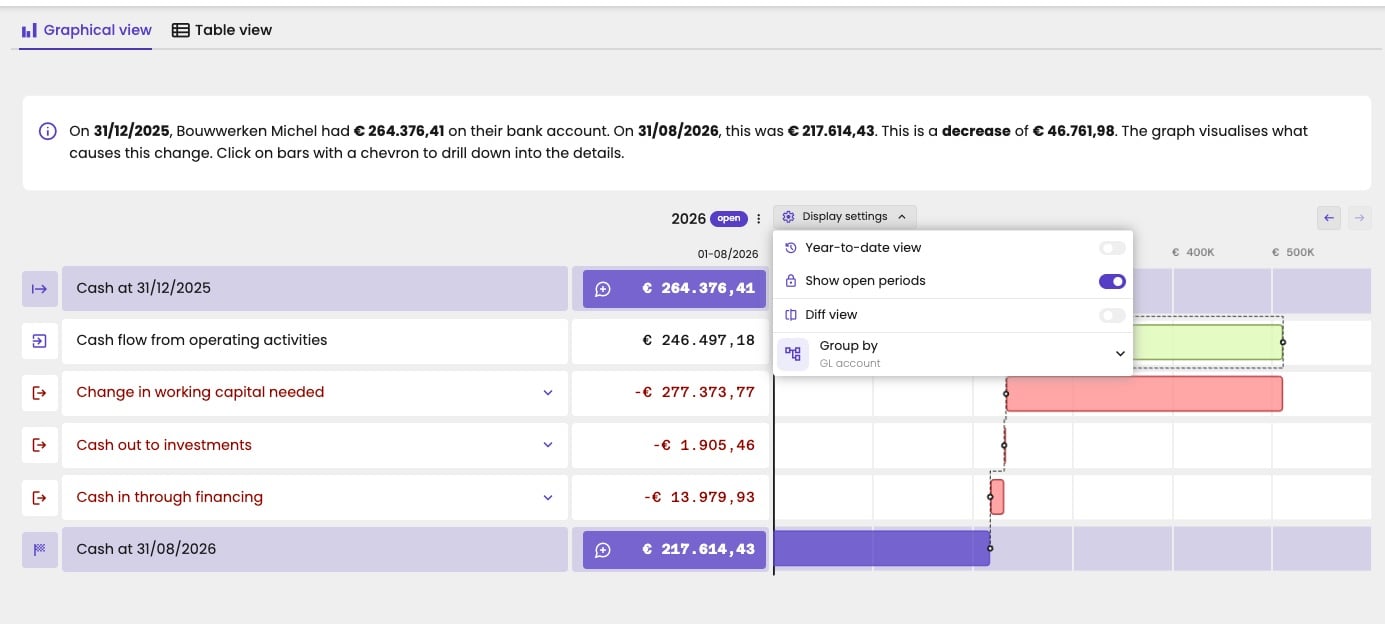
Cash flow waterfall of Bouwwerken Michel for the open year 2026, with the Display settings menu open: Year-to-date view off, Show open periods on, Diff view off, and Group by GL account. The bars form a waterfall, each starting where the previous one ended, from cash at 31/12/2025 to cash at 31/08/2026.

The display settings of the cash flow waterfall.

Diff view

In a normal waterfall, each bar starts where the previous one ended. With Diff view, every bar starts at zero. What adds goes to the right, what subtracts goes to the left. That makes it easier to compare the size of the additions and subtractions with each other.
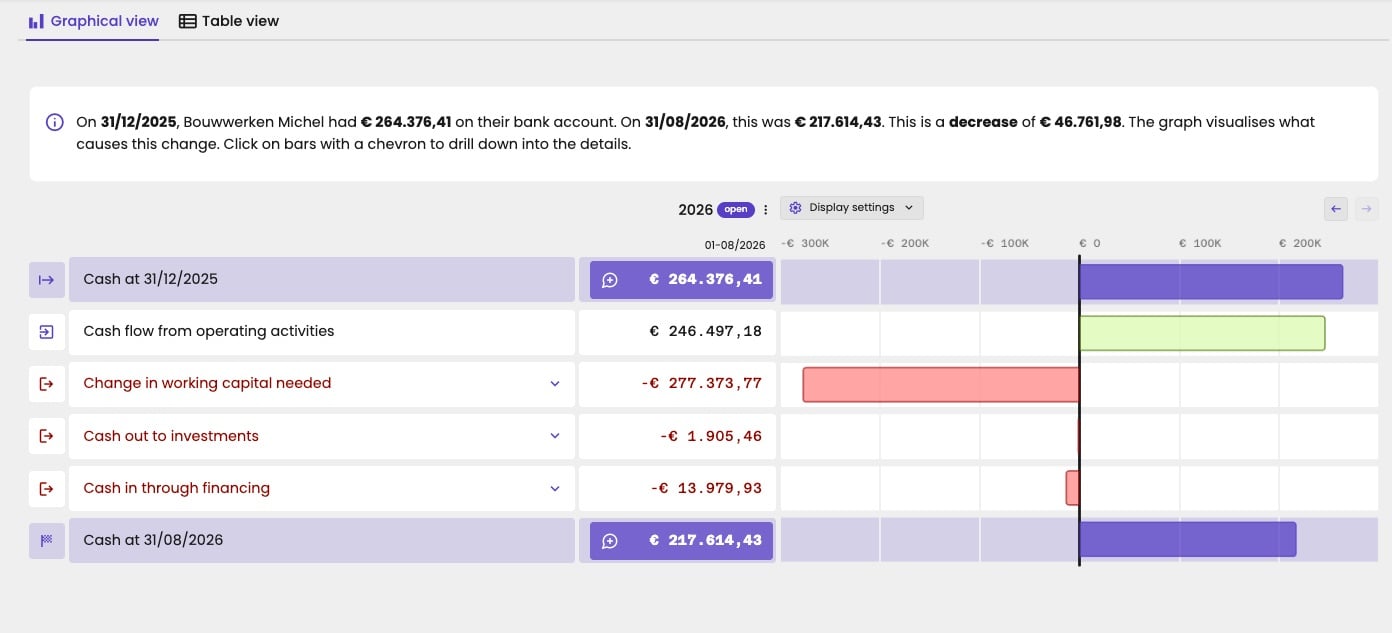
Cash flow waterfall of Bouwwerken Michel with Diff view on. The cash at 31/12/2025, €264,376.41, and at 31/08/2026, €217,614.43, are purple bars from zero. The cash flow from operating activities, €246,497.18, is a green bar to the right of zero. The change in working capital needed, −€277,373.77, cash out to investments, −€1,905.46, and cash in through financing, −€13,979.93, are red bars to the left of zero.

The same cash flow with Diff view on: every bar starts at zero.