

A number on a tab shows how many items it has.
Notifications
aiGust gives every line of the report two notification scores:- Compared with the previous period: how important the change is, in amount and in percentage. You see it on the Details tab, and as the colour of the badges in the report. See Notifications.
- Compared with the peer group: how far the figure is from the benchmark, for example when the company is a top performer or lags behind. You see it on the Benchmark tab.
Transactions
The Transactions tab lists the bookings behind the figure. For turnover in financial year 2025, for example, that’s every booking on the 70 accounts in that year. Together they add up to the figure in the cell.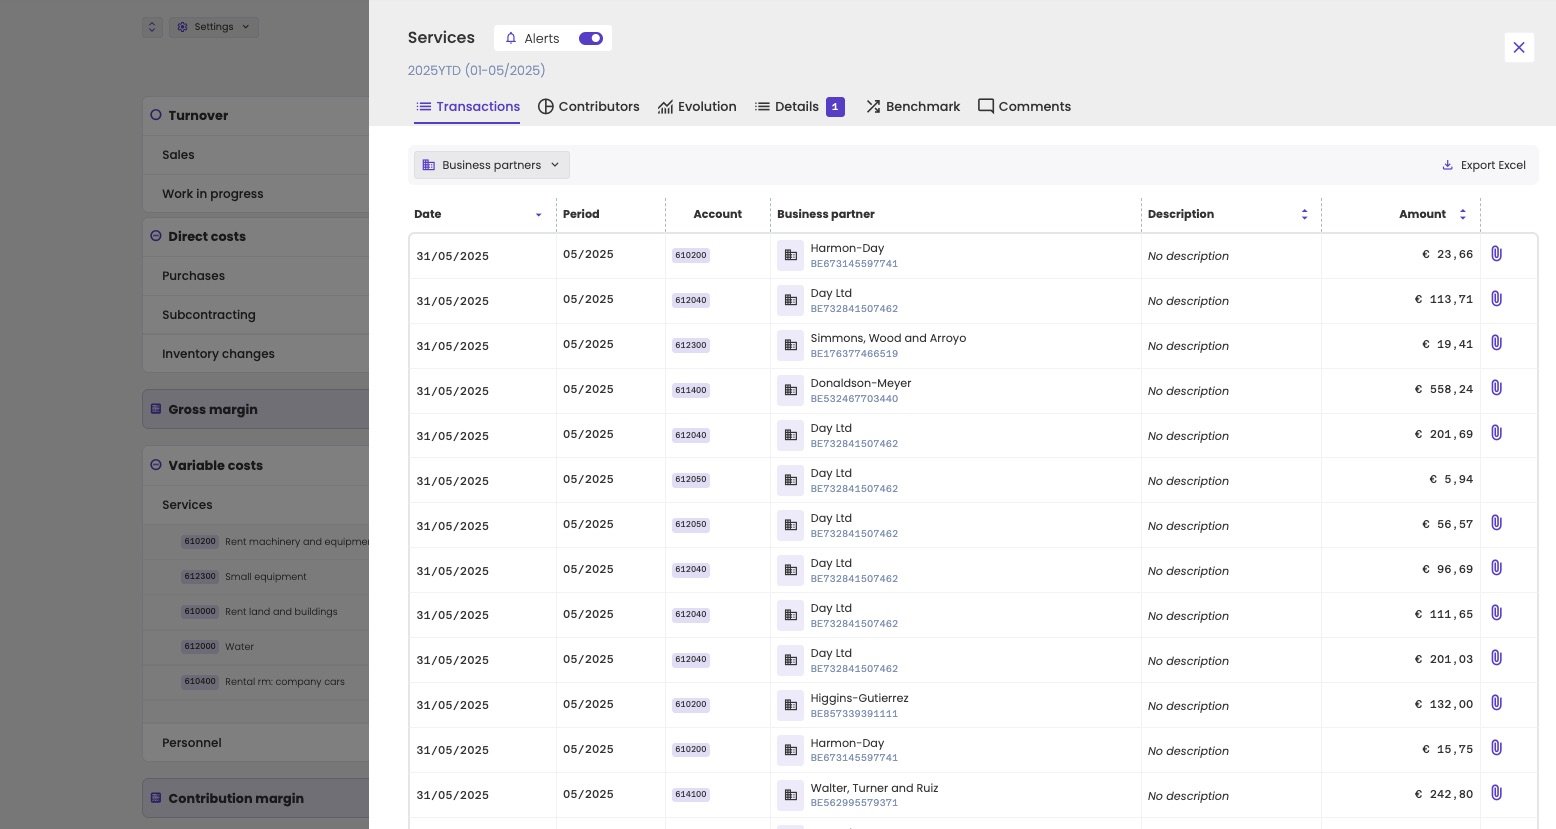
The transactions behind the services of January to May 2025.
- Filter the list by business partner.
- Sort by date, description or amount.
- Export the list with Export Excel.
- Open the attached document, such as the invoice, with the paperclip icon.
Administrations that only come from a compliance connector, such as Silverfin, have no transactions in aiGust.
Contributors
The Contributors tab shows who or what makes up the figure. Click services for January to May 2025, for example, and you see which suppliers account for most of those costs.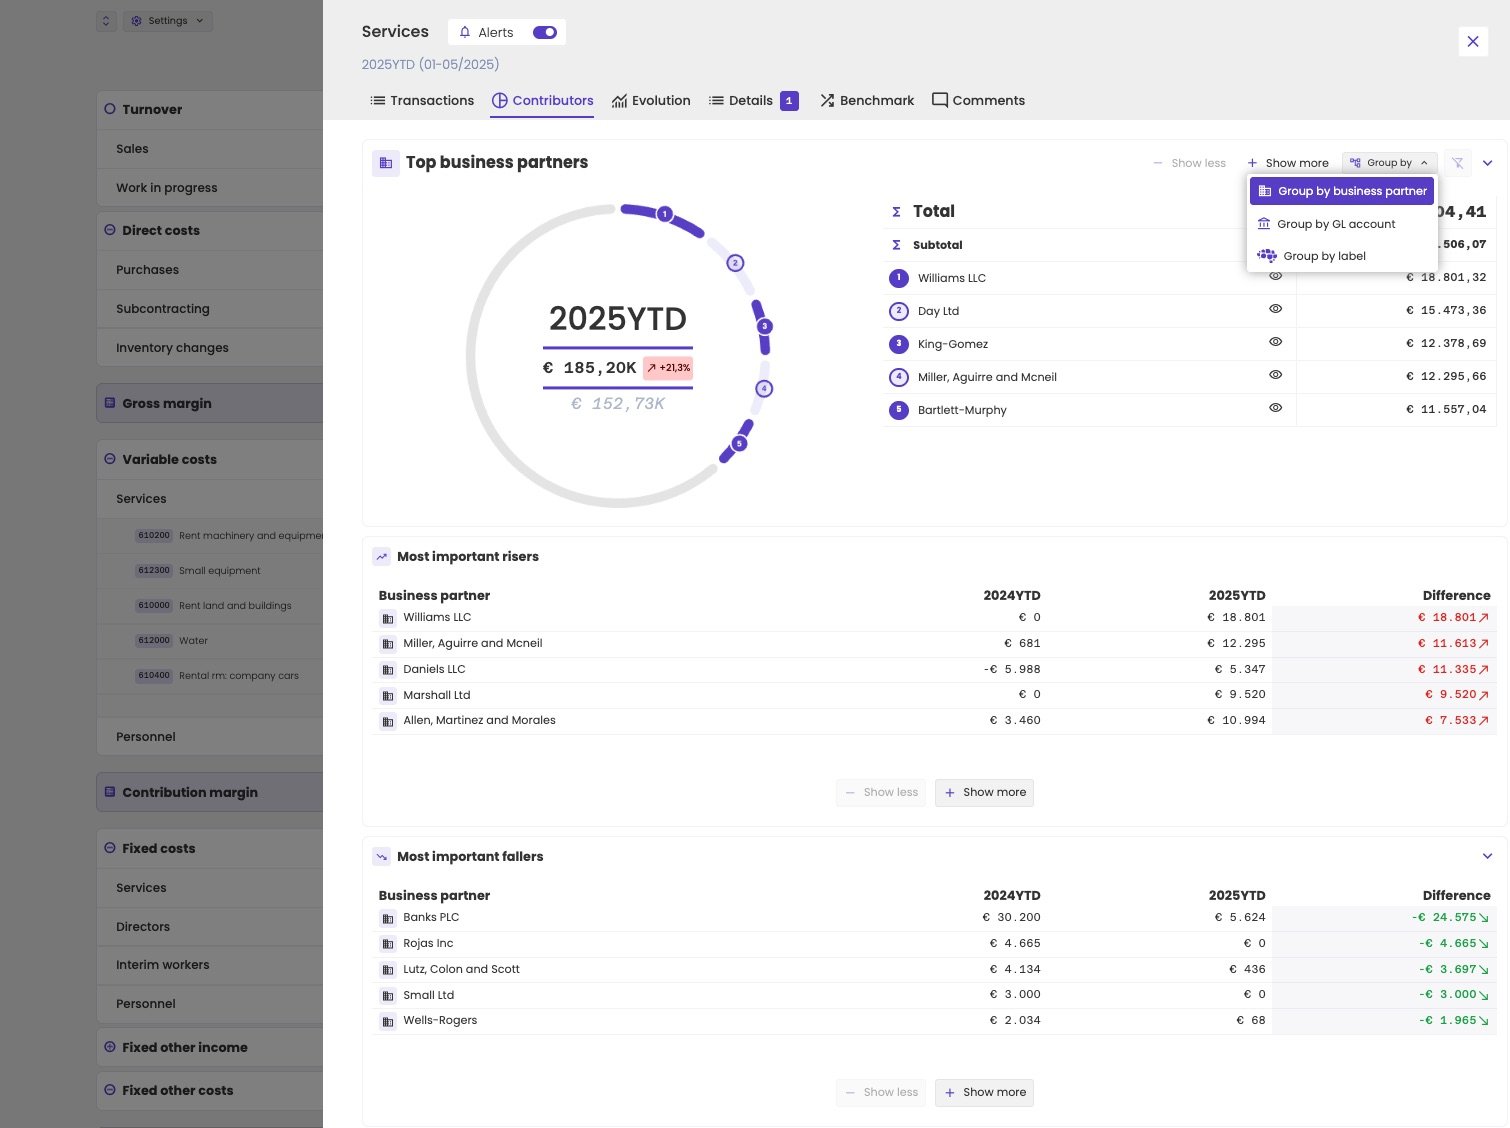
The main contributors to the services, with the biggest risers and fallers.
- Top business partners: a chart and a table of the five biggest contributors. Click Show more to add more, or the eye icon to leave one out.
- Group by: switch between business partner, GL account and label.
- Most important risers and Most important fallers: the contributors that changed most compared with the previous period, in absolute amounts.
Evolution
The Evolution tab shows the figure as a chart over the years, with the benchmark of the administration’s peer group. The chart follows the view you’re in, financial year or year to date, and ends with the period you clicked. Use the KPI type selector to switch between amounts, growth and percentages.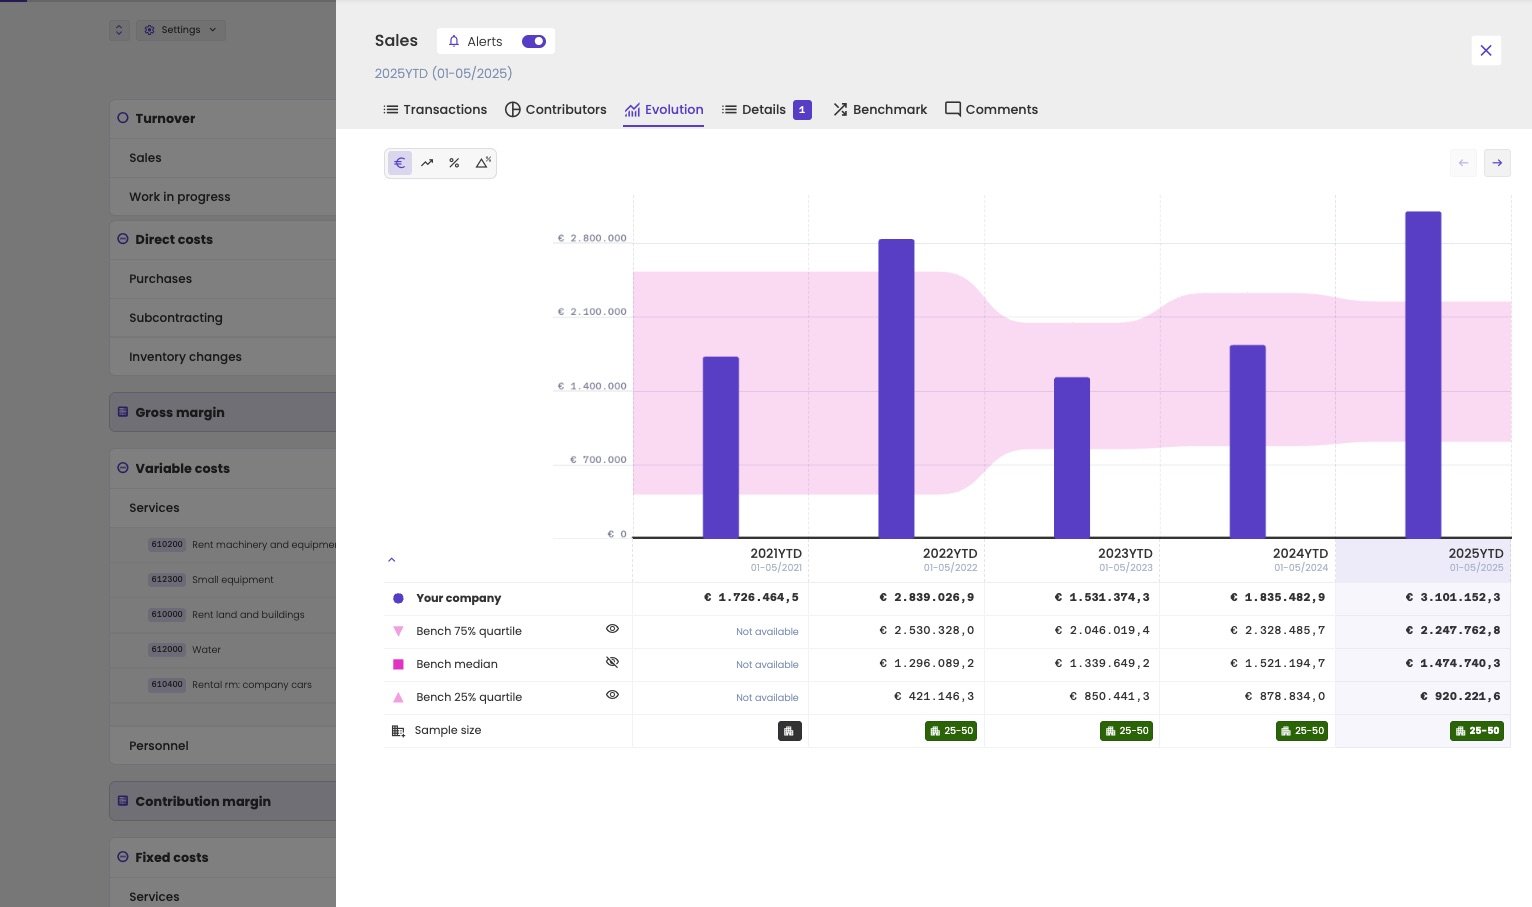
The evolution of sales, January to May of each year, with the benchmark.
Details
The Details tab compares the figure with the previous period, and shows its notification. What you can compare depends on the line. At the top, choose one of the measures:- In €: the amount, for example Turnover in €. Every line has it.
- As a percentage of turnover: for example Gross margin / Turnover as a percentage (%). Lines like the gross margin and the costs have it too. The change is then in percentage points.
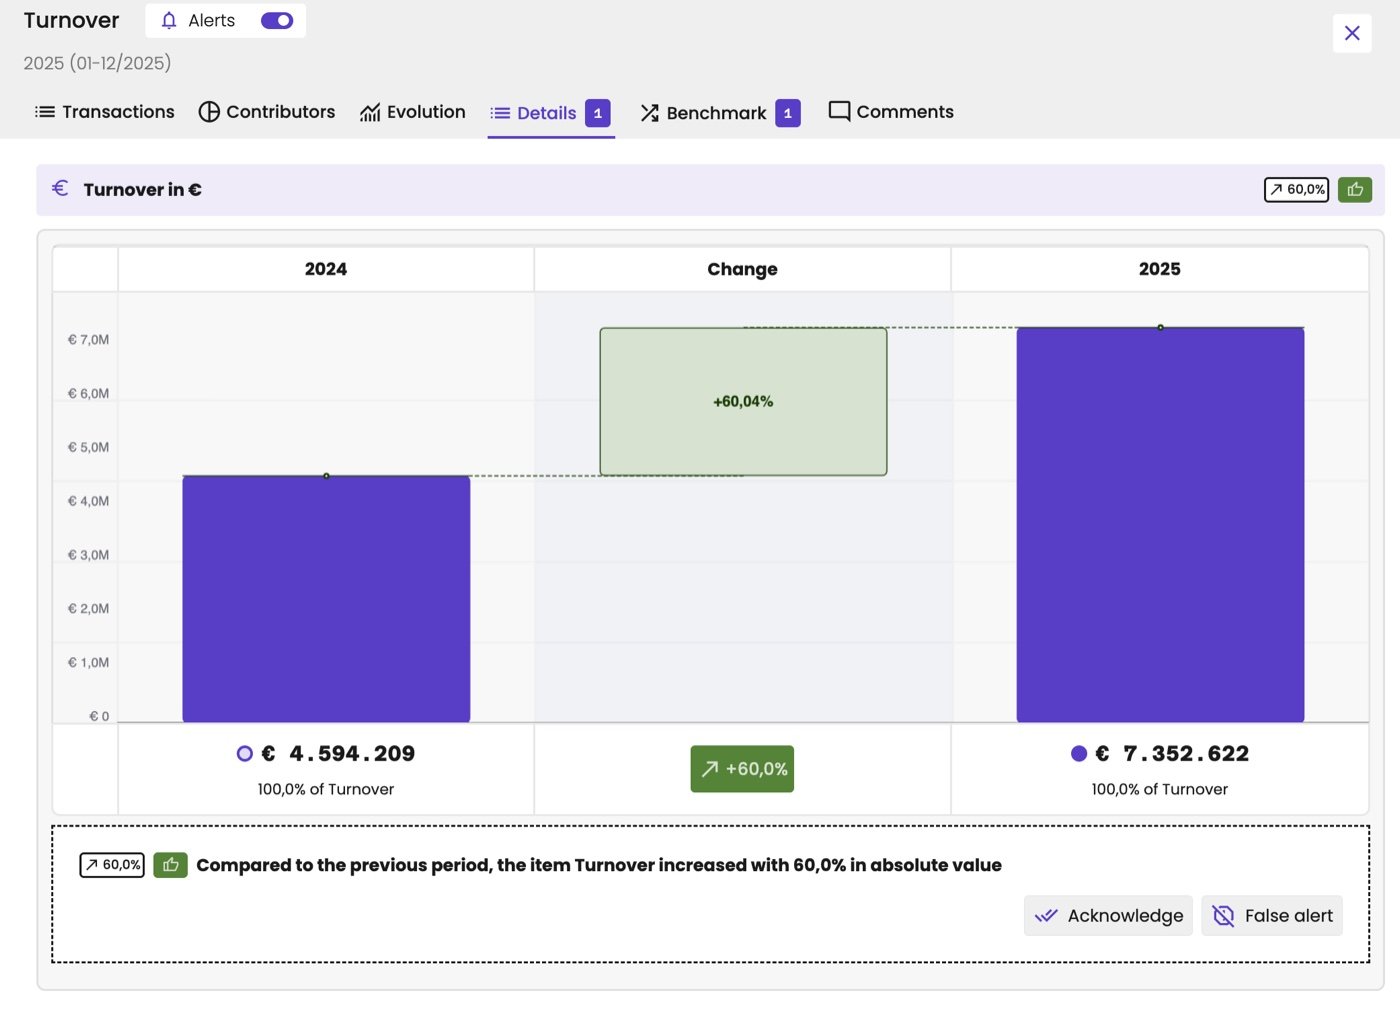
The turnover in euro: an increase of 60% compared with the previous year.
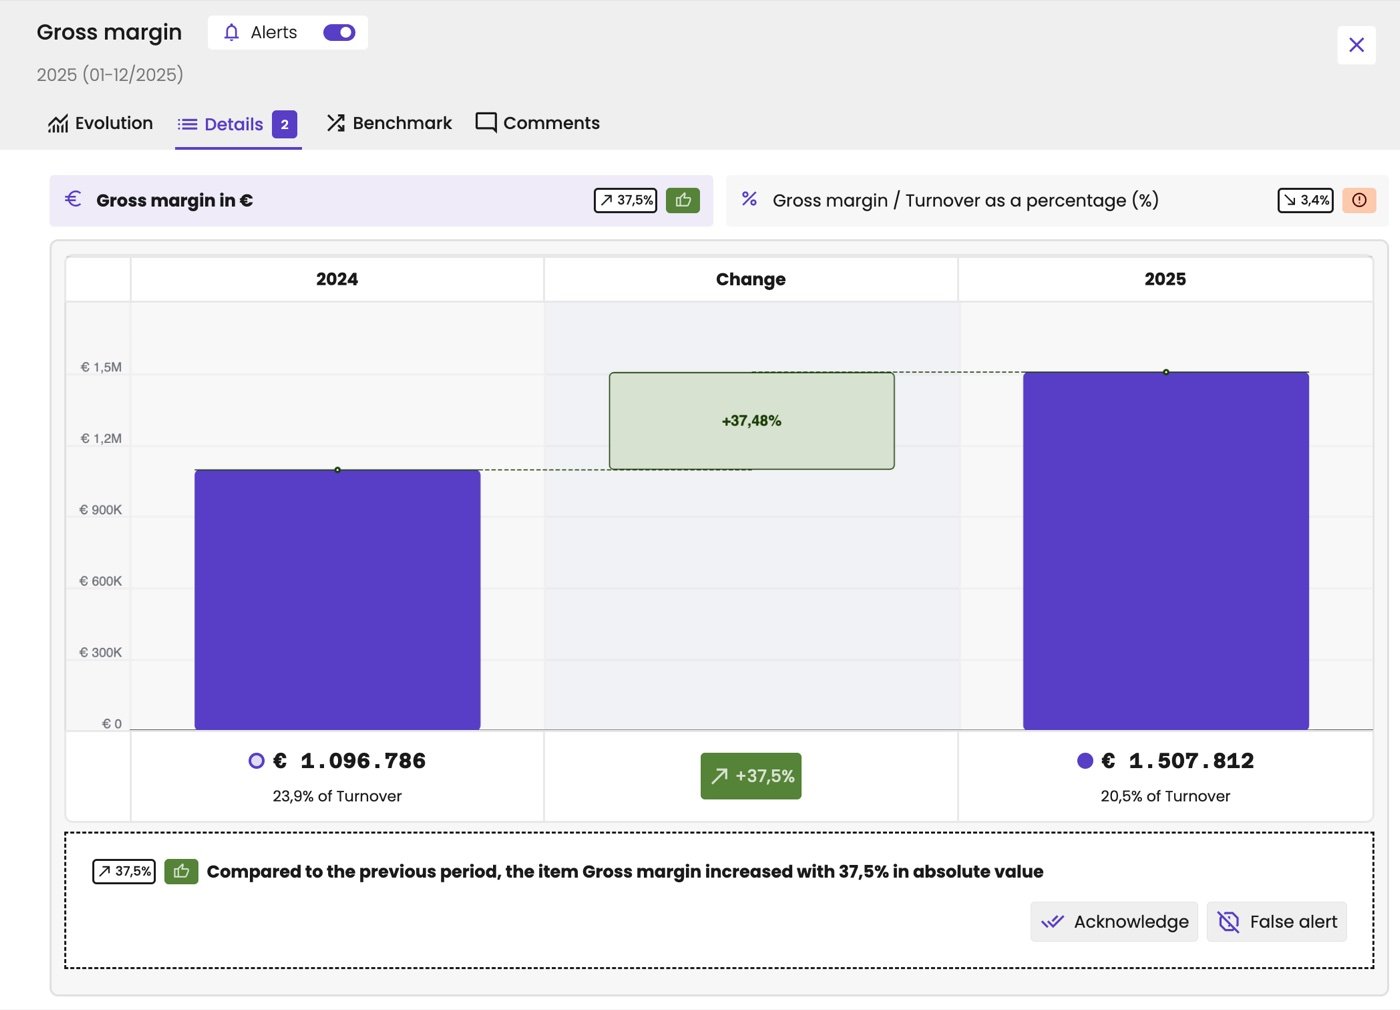
The gross margin has two measures: in euro it grew 37.5%, as a percentage of turnover it dropped 3.4 percentage points.
- Acknowledge: you’ve seen the change. The change badge of this line, for this period, loses its colour in the report. You still see the change itself.
- False alert: the change isn’t an alert. It’s no longer flagged, as if there was no alert.
Benchmark
The Benchmark tab compares the figure with the peer group of the administration. Under Available benchmarks, choose what to compare. What’s available depends on the line:- Turnover: its growth, the Percentage decrease/increase of Turnover compared to the previous period. Turnover itself depends too much on the size of the company to compare.
- Lines like the gross margin: the line as a percentage of turnover, and the change in that percentage compared with the previous period, in percentage points.
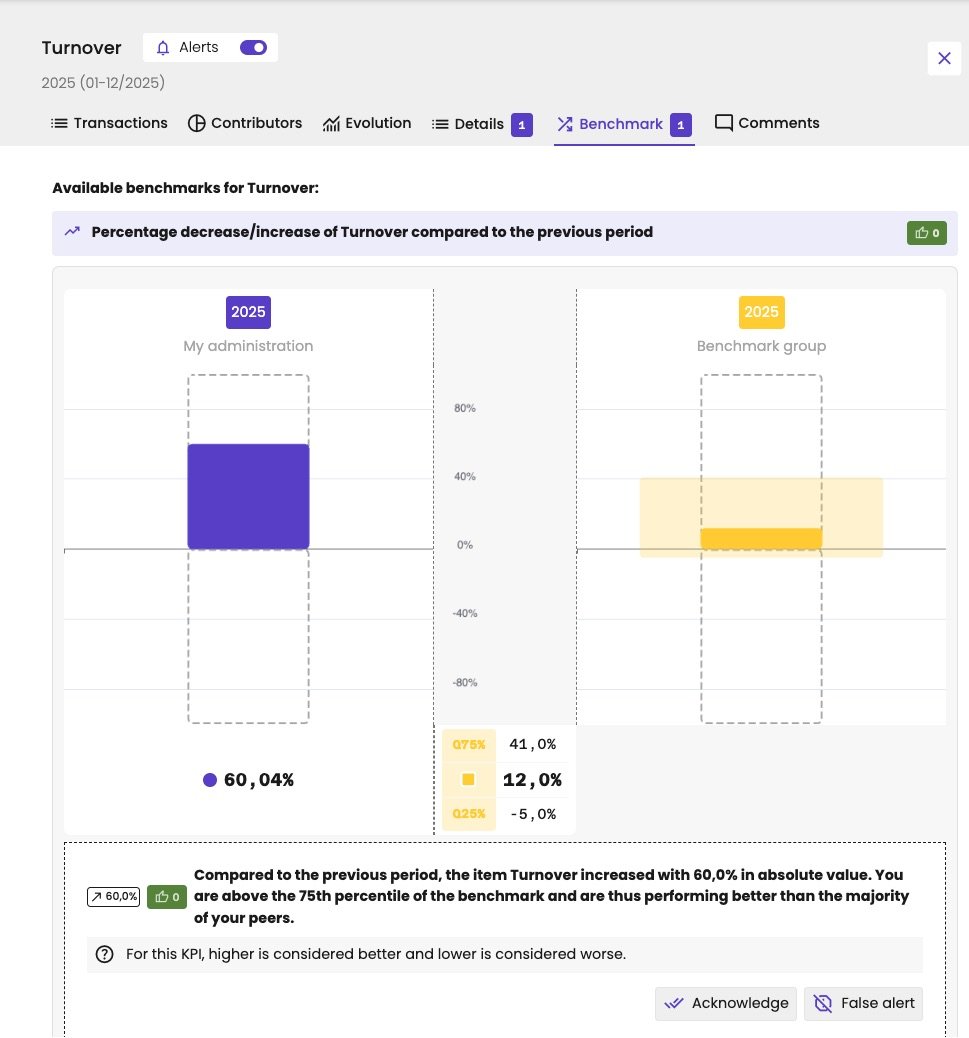
The growth of turnover against the peer group.
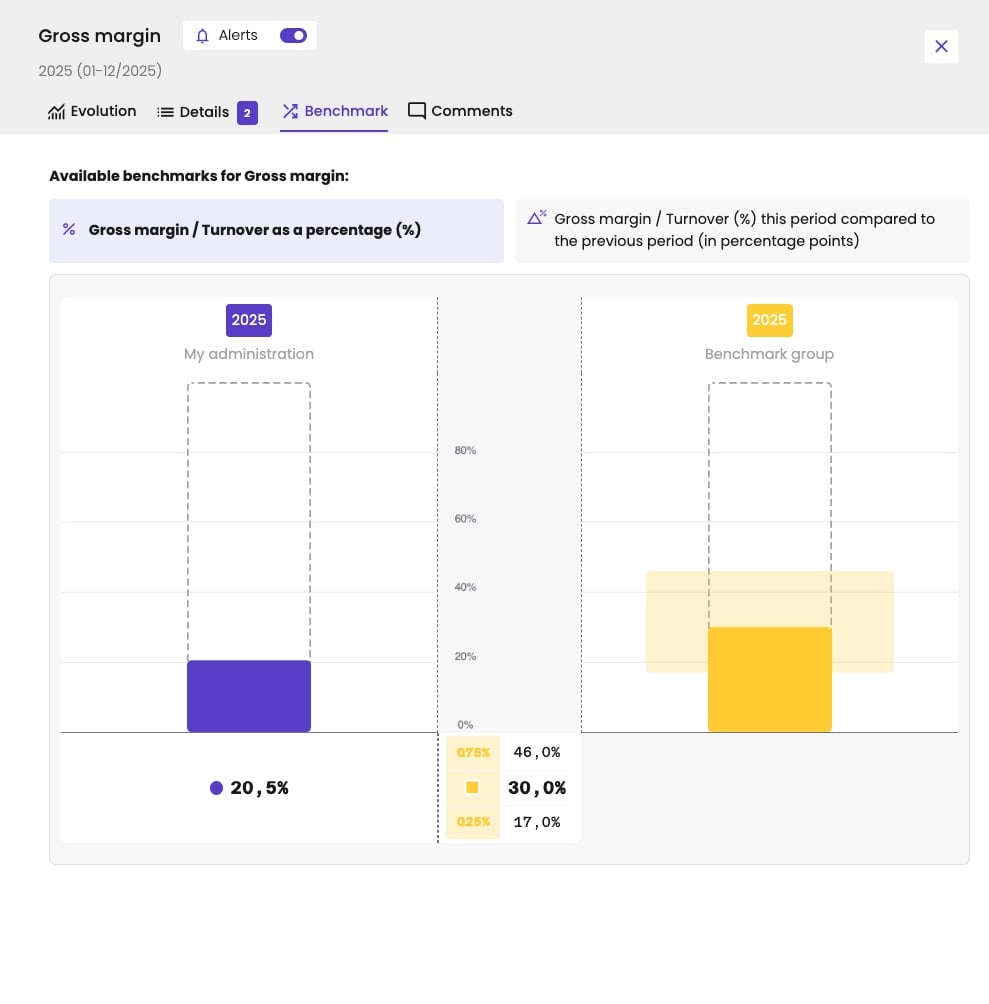
The gross margin as a percentage of turnover against the peer group.