Which customers bring in most of the turnover? Which suppliers drive the costs up? And does the administration get paid faster or slower than its peers? Click Customers or Suppliers under Analysis in the administration menu. Both pages have the same two parts:
  • Top customers or Top suppliers, with the most important risers and fallers;
  • Customer credit or Supplier credit, with the benchmark of the peer group.
Your clients see the same pages on the Customers and Suppliers tabs of the client portal, if your firm turned them on. The top customers and suppliers need transactions with business partners, so they only work for administrations from a bookkeeping connector. For an administration from a compliance file, you see the warning Compliance only instead. See Bookkeeping and compliance connectors.

Top customers and top suppliers

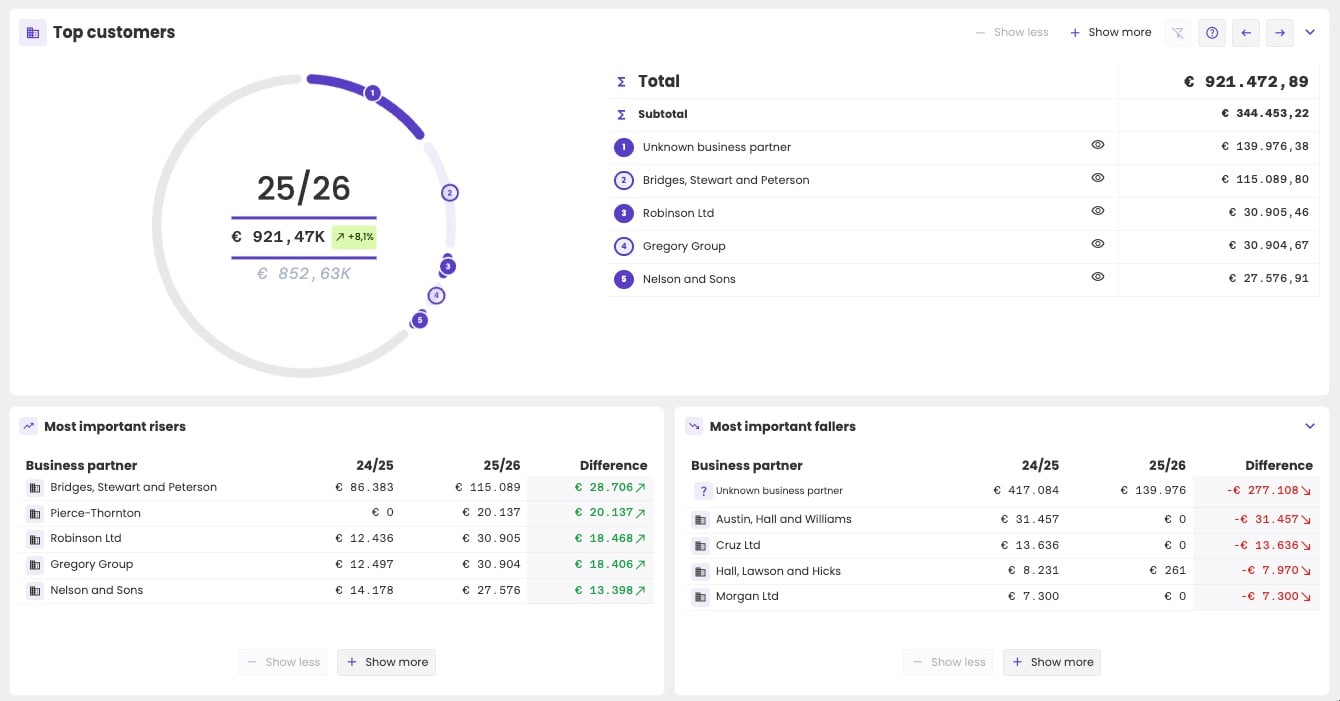
Top customers for 25/26: a ring chart with € 921,47K in the middle, +8,1% compared with € 852,63K the year before, and the five largest customers numbered around it. The table shows the Total of € 921.472,89, the Subtotal of the top five, € 344.453,22, and the five customers: Unknown business partner, Bridges, Stewart and Peterson, Robinson Ltd, Gregory Group and Nelson and Sons, each with an eye icon and an amount. At the top right, Show less, Show more, a filter, help, arrows and a collapse button. Below, Most important risers and Most important fallers, each with five business partners, their amounts in 24/25 and 25/26 and the difference.

The top customers of an administration.

aiGust adds up the transactions per business partner:
  • Customers: the turnover, on accounts 70 and 71.
  • Suppliers: the purchases and services, on accounts 60 and 61, without 618.
In the middle of the ring, you see the financial year, its total, the change compared with the previous year, and the previous year’s total below it. Move to another year with the arrows at the top right. The table next to it shows:
  • Total: all customers or suppliers together;
  • Subtotal: the top five together;
  • the top five, each with their amount.
The ring shows how much of the total the top five account for. A large share for one or two business partners means the administration depends on them.

More or fewer business partners

Click Show more to add business partners, for example to see the top 8 or top 10. Click Show less to remove them again. The Subtotal follows.

Leave a business partner out

Click the eye next to a business partner to leave them out, for example a group company or the Unknown business partner: bookings without a business partner. The totals and the risers and fallers are then calculated without them. The filter icon at the top right lists who you left out. Click the cross next to one to bring them back. Leaving someone out is only temporary, and only for you. When you leave the page and come back, everyone is back.
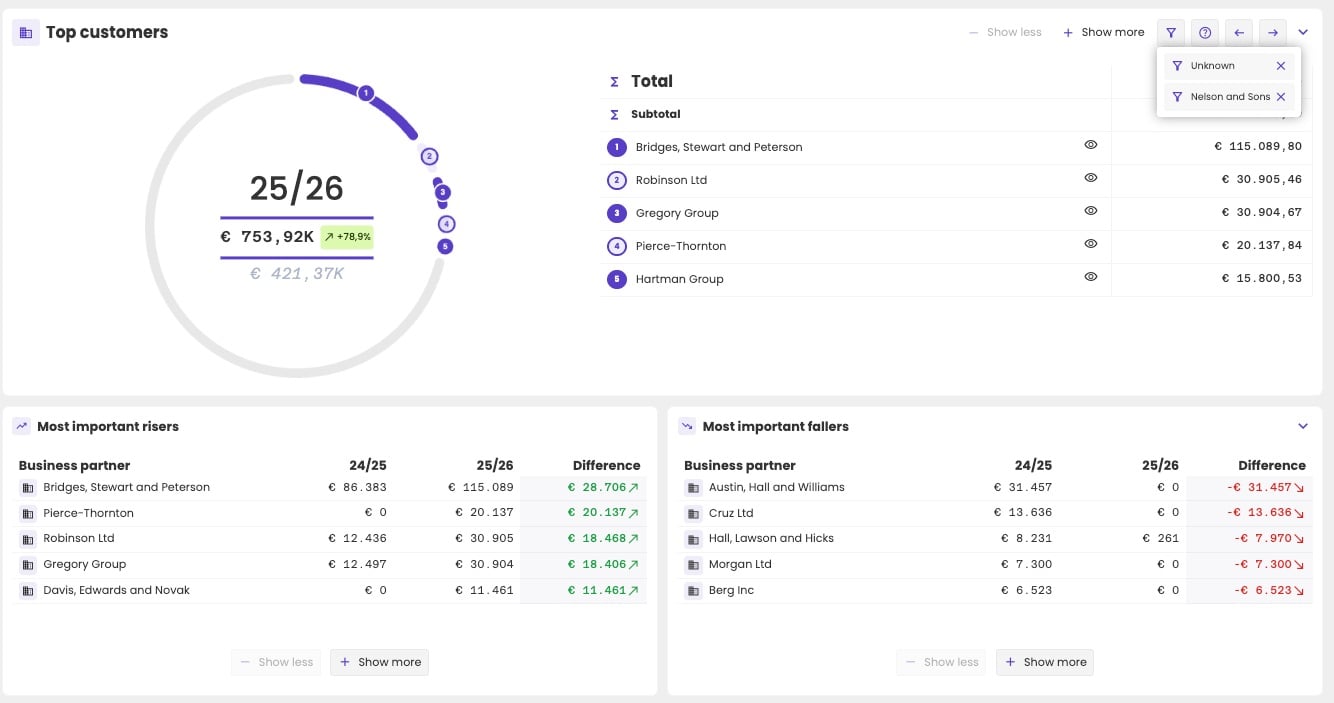
Top customers for 25/26 with the filter list open at the top right, showing Unknown and Nelson and Sons, each with a cross. The ring shows € 753,92K, +78,9% compared with € 421,37K, and the table lists Bridges, Stewart and Peterson, Robinson Ltd, Gregory Group, Pierce-Thornton and Hartman Group.

Two business partners left out: Unknown and Nelson and Sons.

See the transactions

Click an amount, in the chart or in a table, to see the transactions behind it. For example, click a customer to see the invoices that make up their turnover. The Transaction overview opens, with the date, period, account, business partner, description and amount of each booking.
  • Sort by date, description or amount.
  • Export the list with Export Excel.
  • Open the attached document, such as the invoice, with the paperclip icon.
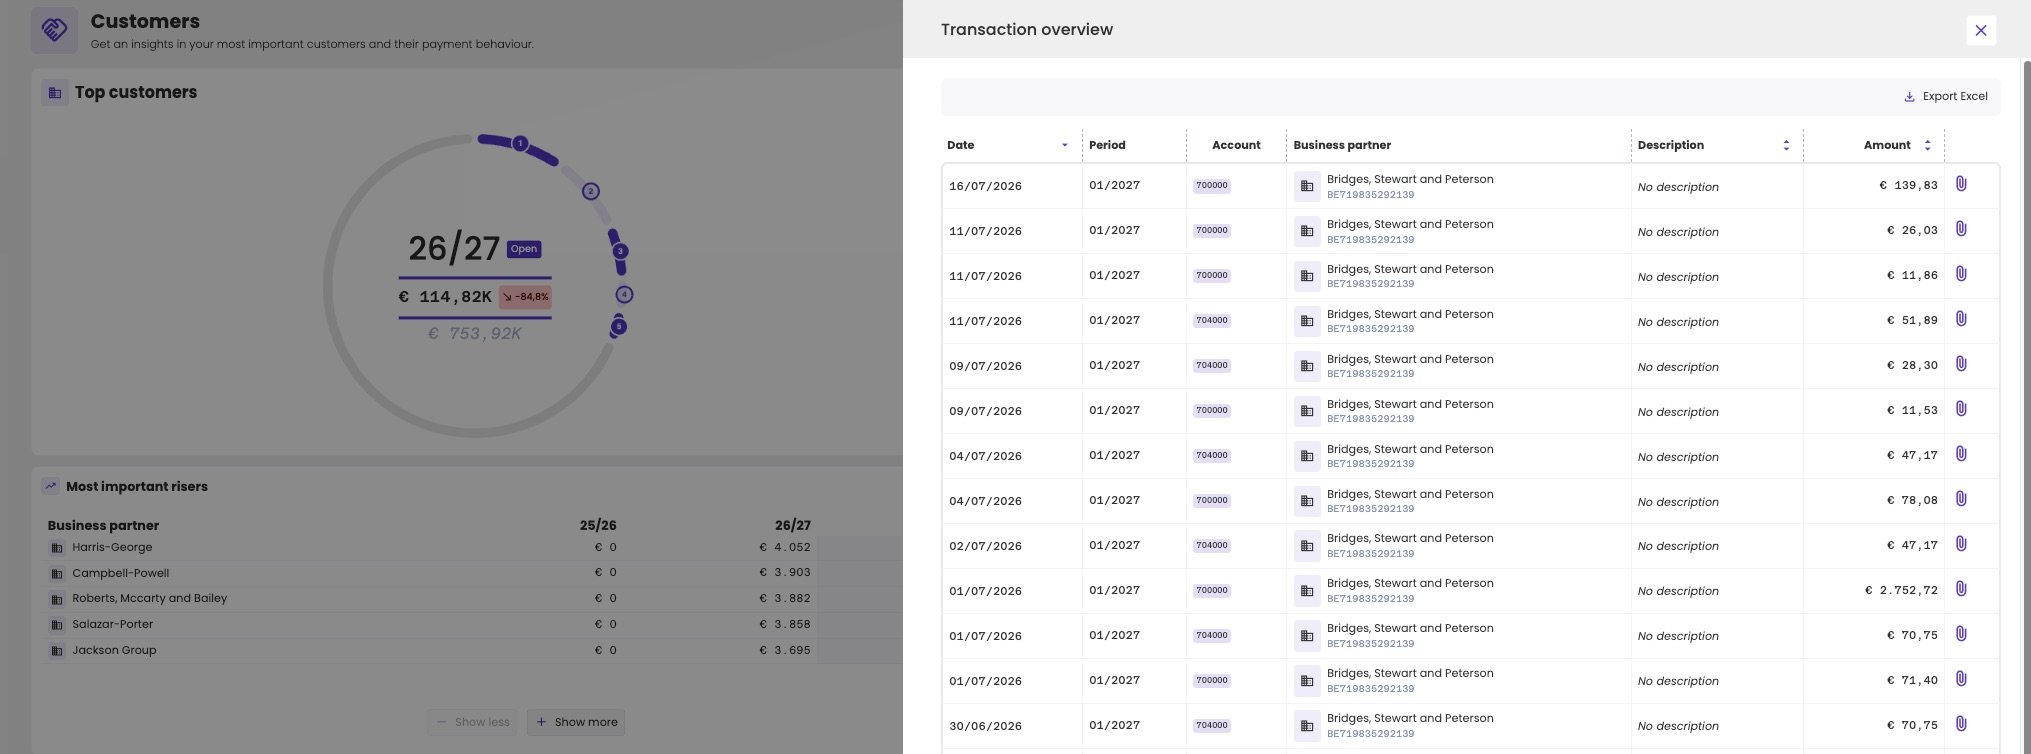
Customers page with the Transaction overview panel open on the right, with an Export Excel button and a list of bookings of Bridges, Stewart and Peterson in July 2026, with their date, period 01/2027, account 700000 or 704000, business partner with VAT number, No description, amount and a paperclip icon.

The transactions behind one customer.

Most important risers and fallers

Below the ring, two tables show who caused the change compared with the previous year:
  • Most important risers: the business partners whose amount went up the most;
  • Most important fallers: the business partners whose amount went down the most.
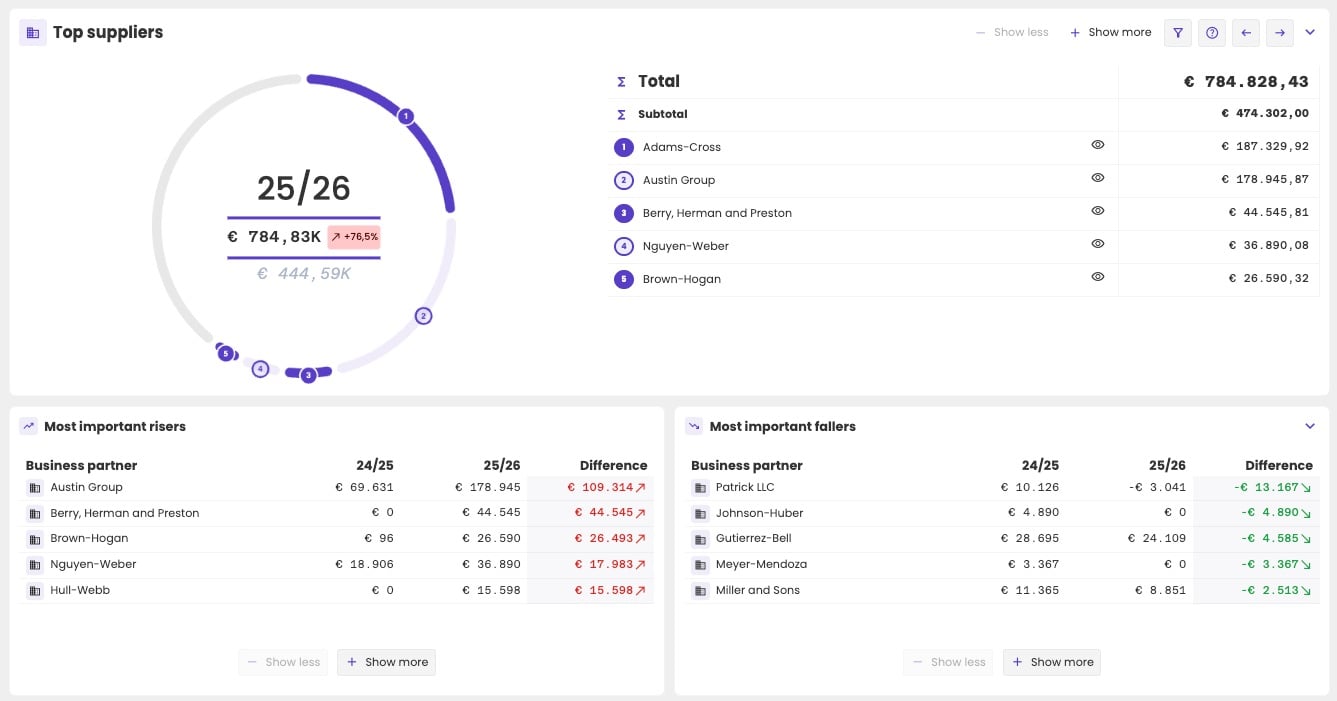
Both rank by the change in euro, not in percent. That shows who really made the difference. A large customer that buys 10% less can cost more turnover than ten small customers that double. A small supplier that goes from € 100 to € 200 grows by 100%, but hardly matters. For customers, an increase is good news and shows in green. For suppliers, it’s a cost increase and shows in red.
Top suppliers for 25/26: € 784,83K, +76,5% compared with € 444,59K, with the Total of € 784.828,43, the Subtotal of € 474.302,00 and the five largest suppliers: Adams-Cross, Austin Group, Berry, Herman and Preston, Nguyen-Weber and Brown-Hogan. Most important risers with differences in red, led by Austin Group with € 109.314. Most important fallers with differences in green, led by Patrick LLC with -€ 13.167.

The top suppliers, with the risers in red and the fallers in green.

The same view elsewhere

The same view is available: There, you choose the accounts yourself, and you can also group by account or by label instead of by business partner. On the Customers and Suppliers pages, the accounts are fixed and the grouping is always per business partner.

Customer credit and supplier credit

  • Customer credit: how many days, on average, customers take to pay.
  • Supplier credit: how many days, on average, the administration takes to pay its suppliers.
For the formulas, see Ratios.
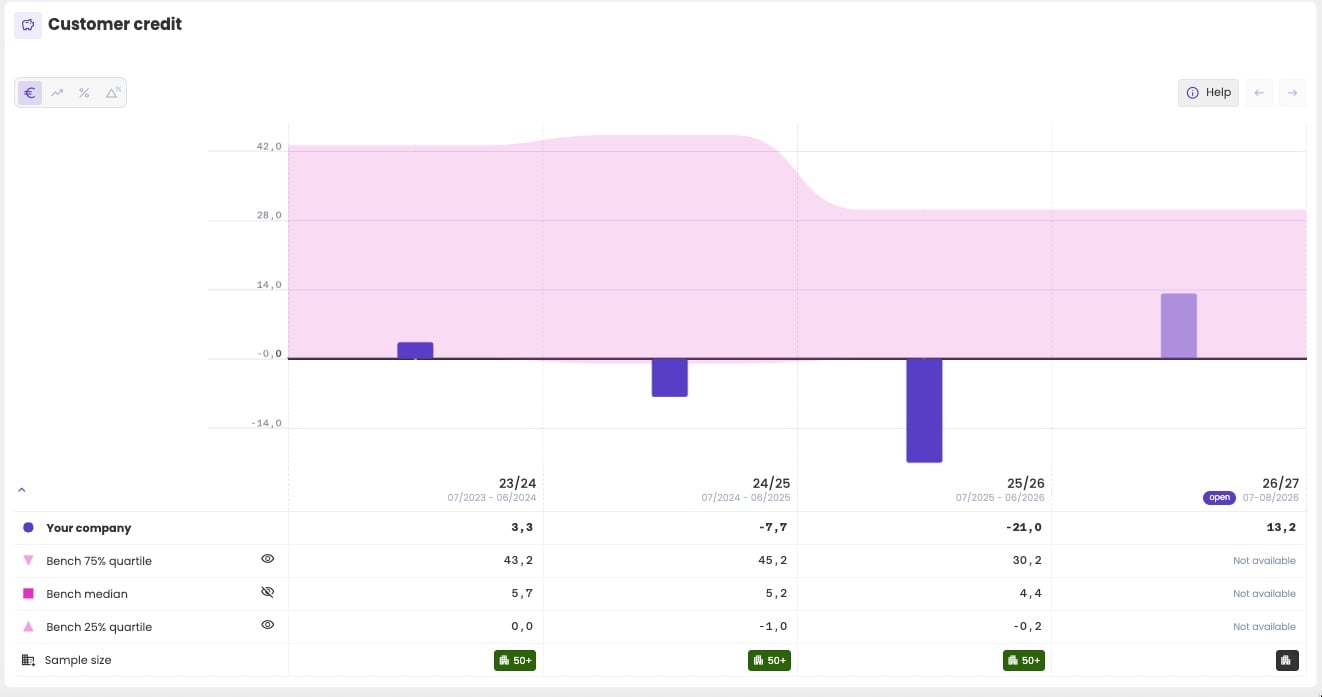
Customer credit chart for the financial years 23/24 to the open year 26/27, with bars for the administration and a band for the peer group. The table below shows Your company 3,3, -7,7, -21,0 and 13,2 days, Bench 75% quartile, Bench median and Bench 25% quartile, Not available for the open year, and the Sample size 50+.

The customer credit, compared with the peer group.
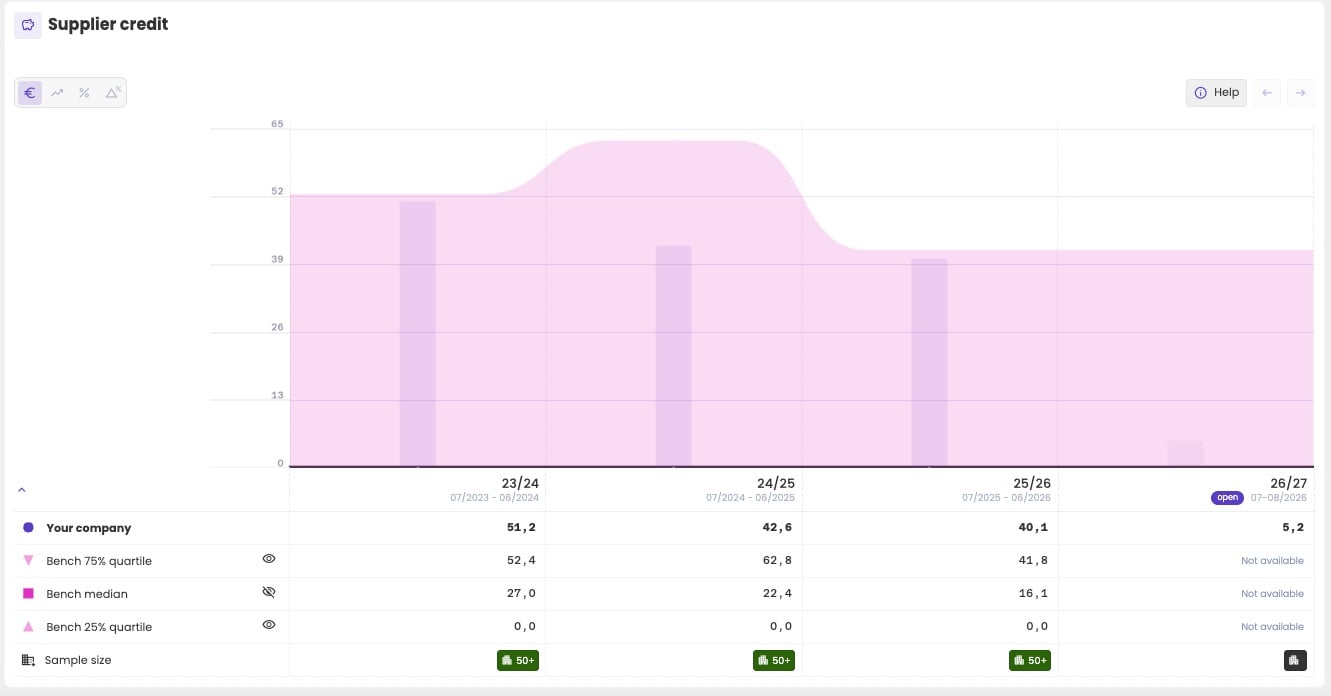
The chart shows the administration’s credit per financial year as bars, and the peer group as a band. The table below it shows the values, the quartiles of the peer group and the sample size. See Benchmarks in charts. Click Help for an explanation in aiGust itself, and use the KPI type selector to see the values or their growth. Customer credit can be negative, when prepayments received and VAT payable are larger than the receivables.
Supplier credit chart for the financial years 23/24 to the open year 26/27, with the table below showing Your company 51,2, 42,6, 40,1 and 5,2 days, the quartiles of the peer group, Not available for the open year, and the Sample size 50+.

The supplier credit, compared with the peer group.