

Both widgets are on the administration dashboard, and you can also add them to meeting slides.
How the score works
Both scores work the same way:- The administration starts with a score of 5 out of 10.
- aiGust looks at five KPIs: revenue growth, EBITDA margin, cash flow, liquidity and solvability.
- For each KPI, the score goes up by 1 if the result is good, stays the same if it’s normal, and goes down by 1 if it’s weak.
An administration that’s normal on every KPI keeps its starting score of 5, and is Normal. It needs at least two KPIs more on the good side than on the weak side to reach Good.
Click the information icon on the widget to see how the score was built up.
Performance vs benchmark
Performance vs benchmark compares the administration’s KPIs with its default peer group. For each KPI, it looks at where the administration sits compared with the benchmark band from Q25 to Q75:
“Better” depends on the KPI: higher revenue growth is better, but for a cost, higher is worse.
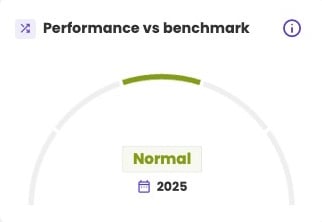
The Performance vs benchmark widget.
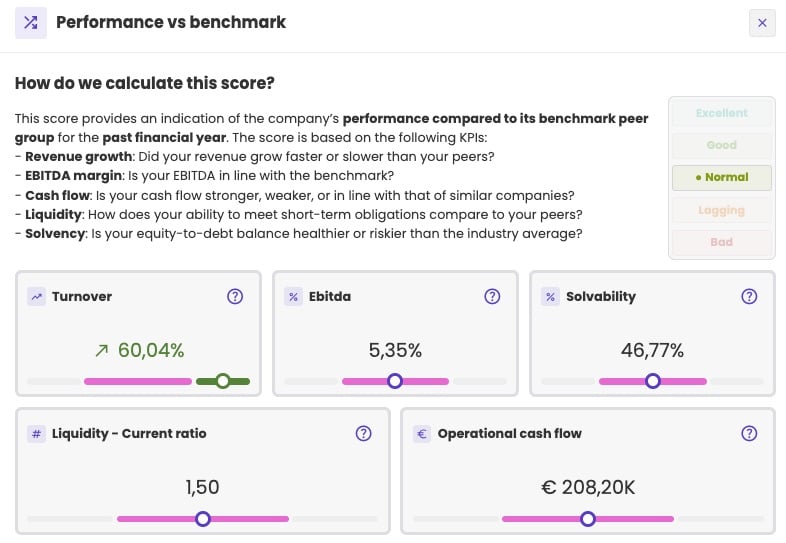
The score details: the five KPIs, each with the administration's value on the peer group's band.
Administration score
The Administration score looks at the administration on its own. Instead of comparing with peers, it checks each KPI against fixed thresholds:
Revenue growth needs to be above 2% to count as good: roughly, growth that beats inflation. EBITDA margin evolution is the vertical delta of EBITDA, in percentage points (pp).
Related pages
Read benchmarks
How the benchmark band is calculated and shown.
Administration dashboard
The other widgets on the dashboard.