

Peer groups
A peer group is a set of companies an administration is compared with, such as road transport companies with a turnover between €1M and €7M.- Peers come from the entire aiGust database, not just from your own firm’s administrations. That gives you enough peers, even for a niche.
- Benchmarking works per administration. You compare one administration with a peer group. aiGust doesn’t provide sector overviews.
- An administration can use several peer groups, for example aiGust’s standard group for its subsector, and a group of your own that’s limited to its province. You choose which one to show.
Quartiles: what a benchmark shows
aiGust never shows the figures of individual peers. It shows how their values are spread, using quartiles. A school class is the easiest way to see how that works.Example: grades in a class
Your child scores 62% on a maths test. They passed, but is that good enough? Schools often only give you the class average, which doesn’t say much.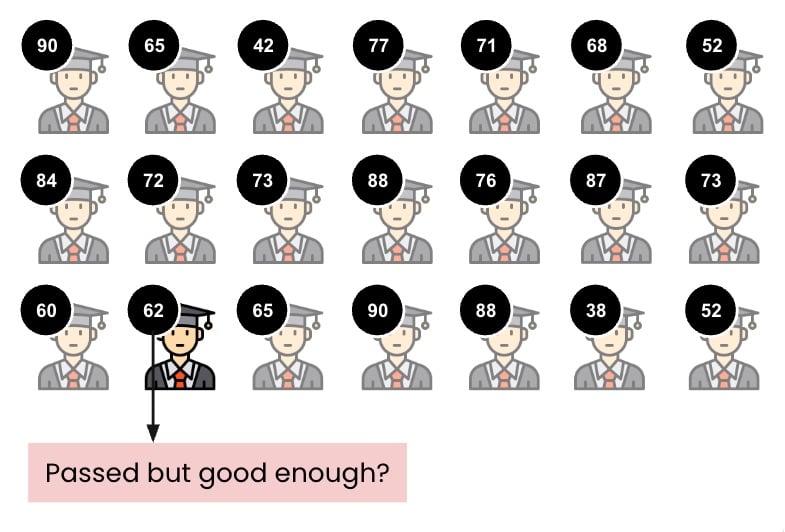
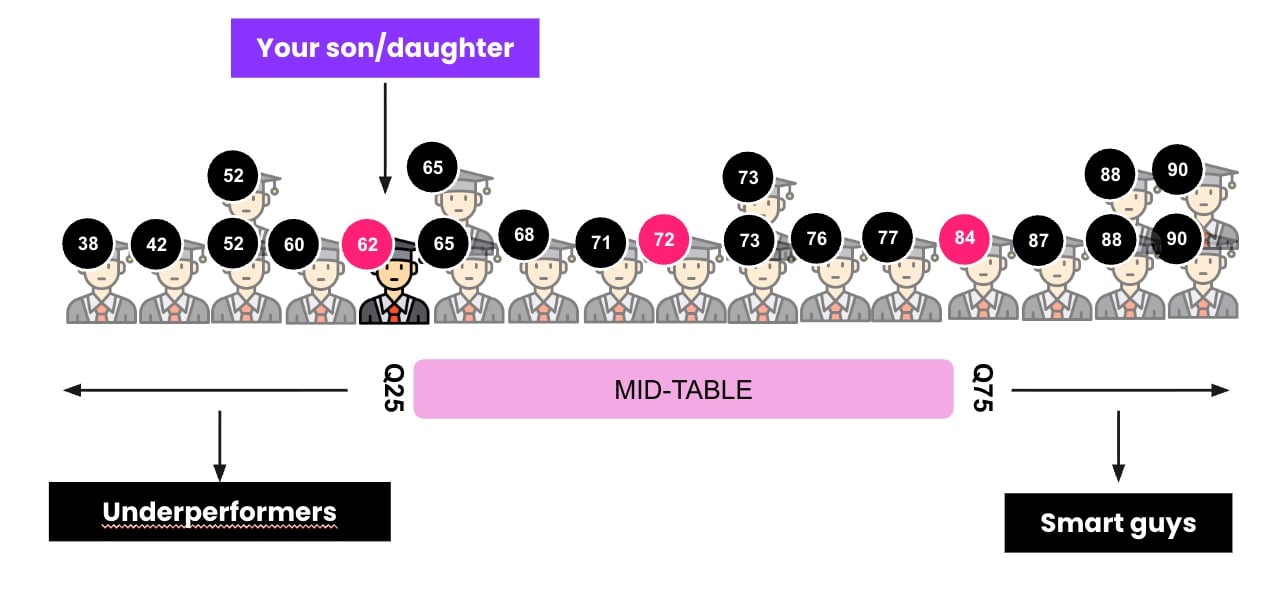
- Q25, the first quartile: a quarter of the class scored lower, three quarters scored higher.
- Q50, the median: half the class scored lower, half scored higher.
- Q75, the third quartile: three quarters of the class scored lower, a quarter scored higher.
From a class to a peer group
A benchmark works the same way. Take a logistics company with a turnover of €3M. aiGust compares it with road transport companies with a turnover between €1M and €7M. The turnover range keeps out single-truck operators and large carriers, which would skew the comparison.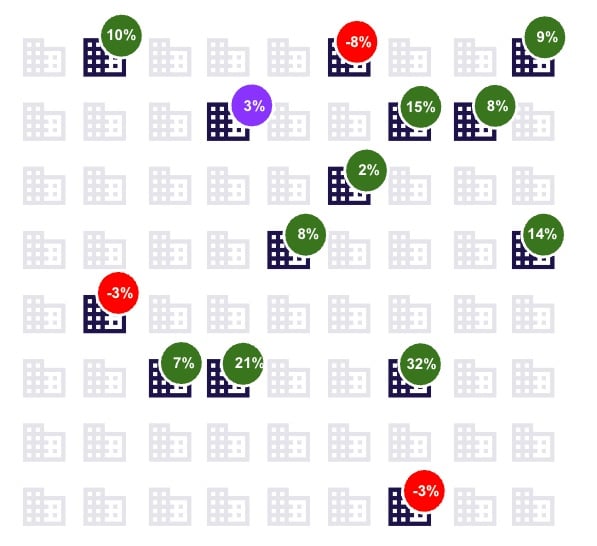
aiGust finds the companies that match the peer group's criteria in its database.
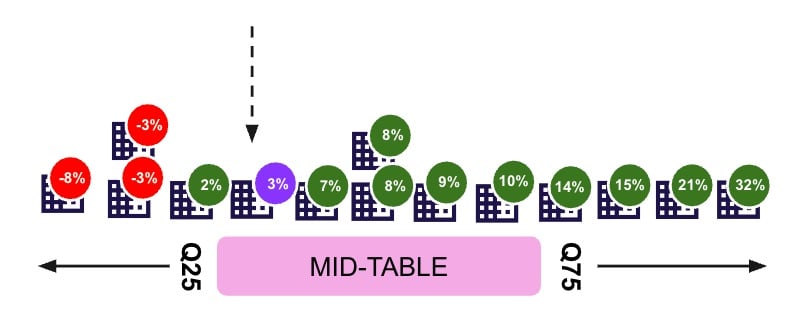
Ranked by turnover growth, the company's 3% sits at Q25, the bottom of the band.
Privacy
Benchmarks never reveal individual companies:- aiGust only shows statistics: the quartiles and the median, never the figures of a single peer.
- A peer group needs at least 10 peers. With fewer, you can’t use it. For a year with fewer than 10 peers, aiGust shows no benchmark.
Choose the right KPI type
Every KPI can be benchmarked in each of its KPI types. The type you look at determines which question the benchmark can answer. This is where it’s easiest to draw the wrong conclusion.
Medians can’t be combined like ordinary figures. The two examples below show why.
Growth: use the horizontal delta
Five peers, with their turnover in two years:
The median turnover rose from €200 to €800, which looks like growth of 300%. In reality, three of the five peers shrank, and the median growth is −10%. To say something about growth, always use the benchmark of the horizontal delta, never compare the benchmarks of absolute values between years.
Margins: use the benchmark of the margin itself
Five peers, with their turnover, direct costs and margin:
If you subtract the median direct costs from the median turnover, you get a margin of €5,000. The real median margin is −€1,000. The same goes for percentages: dividing one median by another doesn’t give you the median percentage. Always look at the benchmark of the KPI you’re interested in, in the right KPI type, rather than calculating it from other benchmarks.
Different financial years
Not every company closes its financial year on 31 December. Most close at the end of March, June, September or December. aiGust therefore matches each peer’s figures to the administration’s periods before calculating the benchmark.Financial year benchmarks
The administration’s financial year is the reference, called the benchmark period. For each peer, aiGust looks for a financial year that matches it:- Only closed financial years count.
- The financial year must overlap at least 50% of the benchmark period.
- If several financial years qualify, aiGust takes the one with the largest overlap. If two overlap equally, for example 6 months each, it takes the older one. That way, peers whose current financial year hasn’t closed yet still count, and the peer group doesn’t drop below 10.
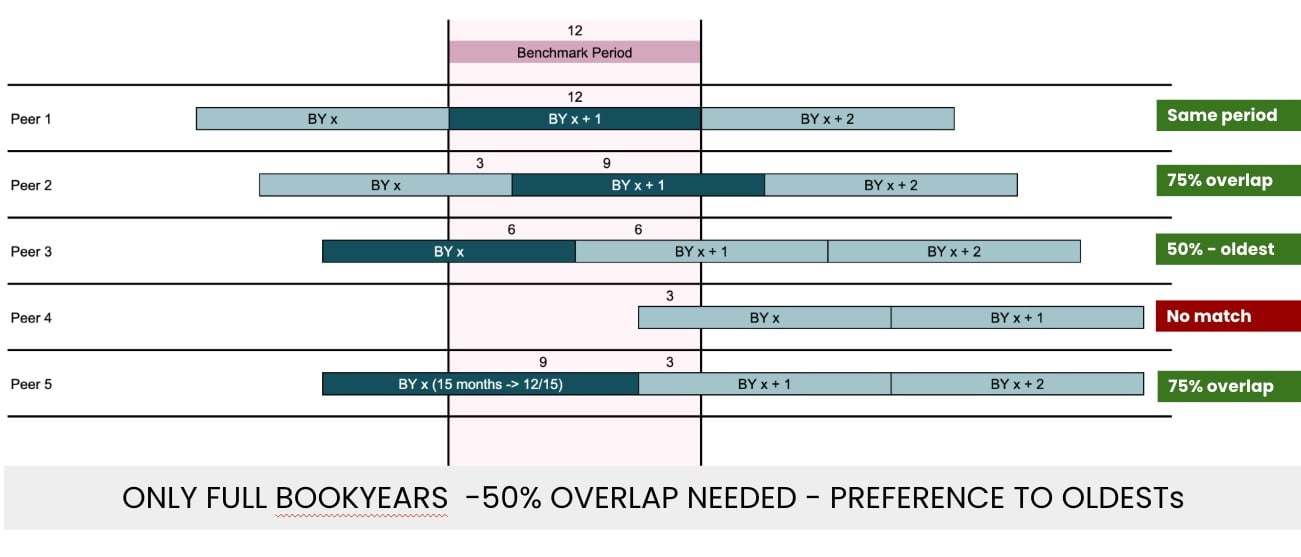
Matching peers' financial years (BY) to the benchmark period.
Year-to-date benchmarks
For a year-to-date benchmark, the benchmark period is the administration’s YTD window, for example 1 January to 31 May. For each peer, aiGust tries to build a period that fully covers that window:- It combines the peer’s closed periods. Open periods are never used.
- The combined periods must cover the whole window. If they extend beyond it, for example with quarterly periods, aiGust pro-rates the figures to the window.
- If the periods don’t cover the whole window, the peer doesn’t count for that benchmark.
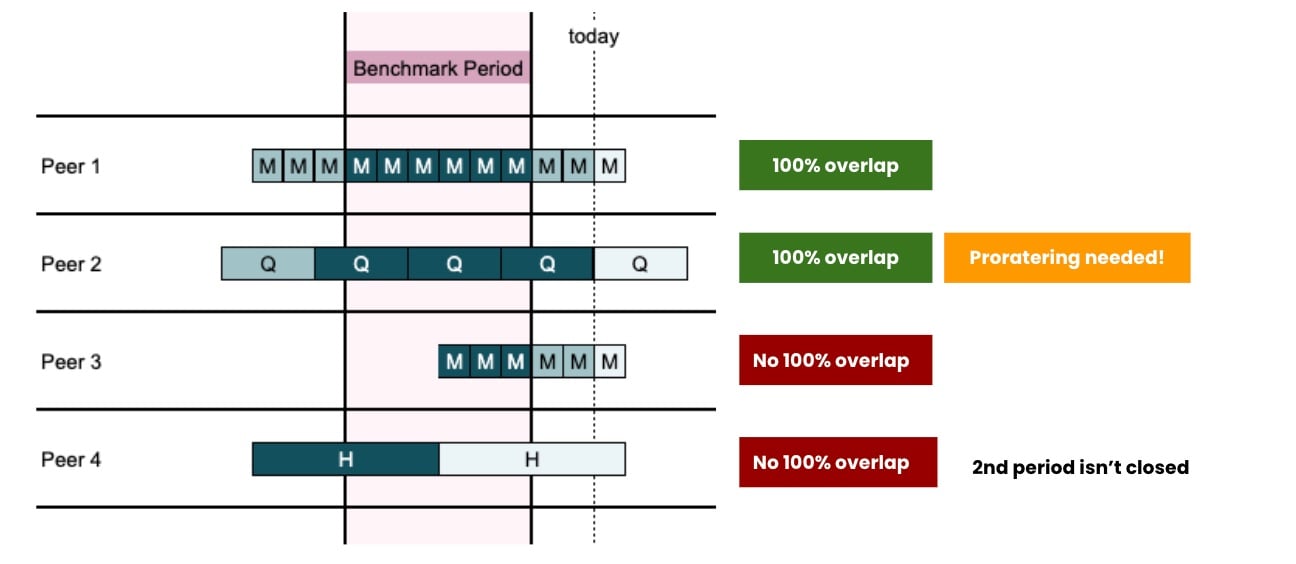
Matching peers' periods to a year-to-date benchmark period. M = month, Q = quarter, H = half year.
Related pages
Create peer groups
Use aiGust’s default peer groups or define your own.
Read benchmarks
Benchmarks in charts, KPI cards and the Performance vs benchmark widget.