The balance sheet’s Graphical view tab shows it as blocks, so you see its structure at a glance.

Layout

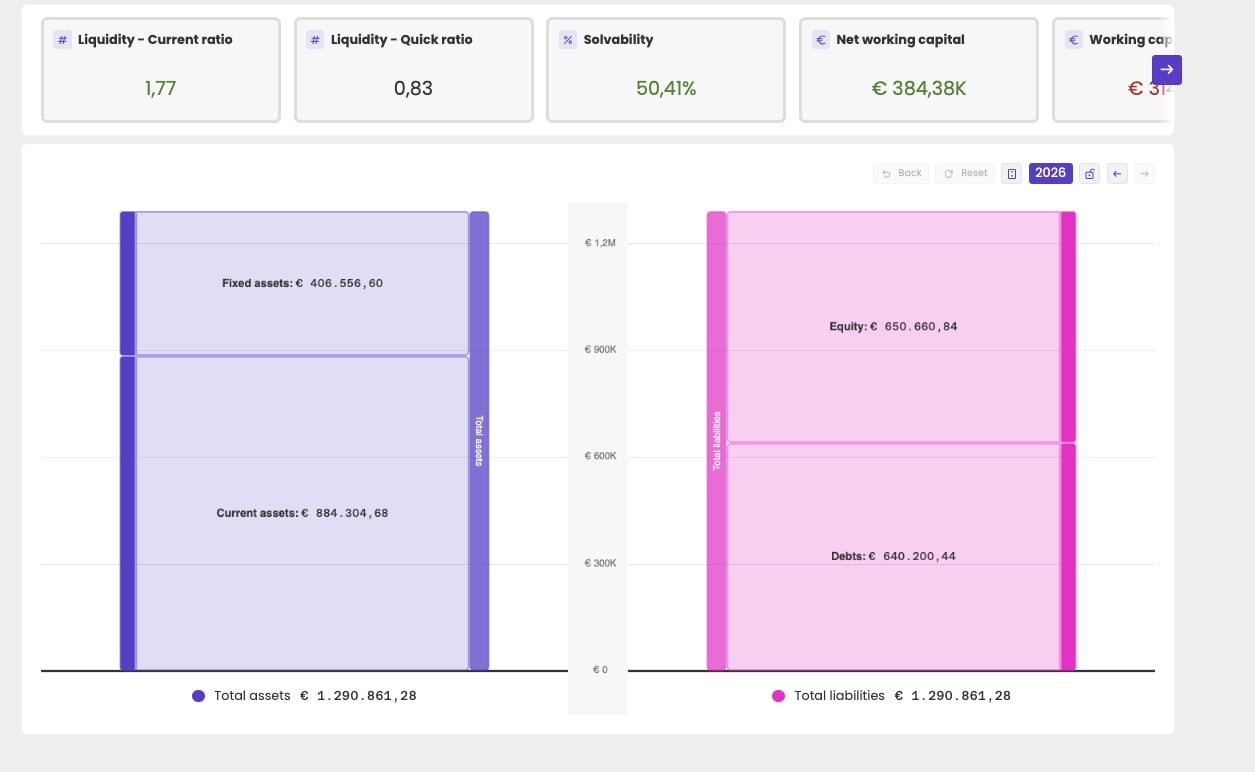
Balance sheet visual with KPI cards for Liquidity current ratio, Liquidity quick ratio, Solvability, Net working capital and Working capital needs; below them, total assets split into fixed assets and current assets on the left, and total liabilities split into equity and debts on the right

The balance sheet as blocks, with the main ratios at the top.

  • Total assets are on the left, split into fixed assets and current assets.
  • Total liabilities are on the right, split into equity and debts.
Both sides are always equal in total.

Drill down

Click a block to see what it’s made of. Click current assets, for example, to see stock and work in progress, accounts receivable and liquid assets.
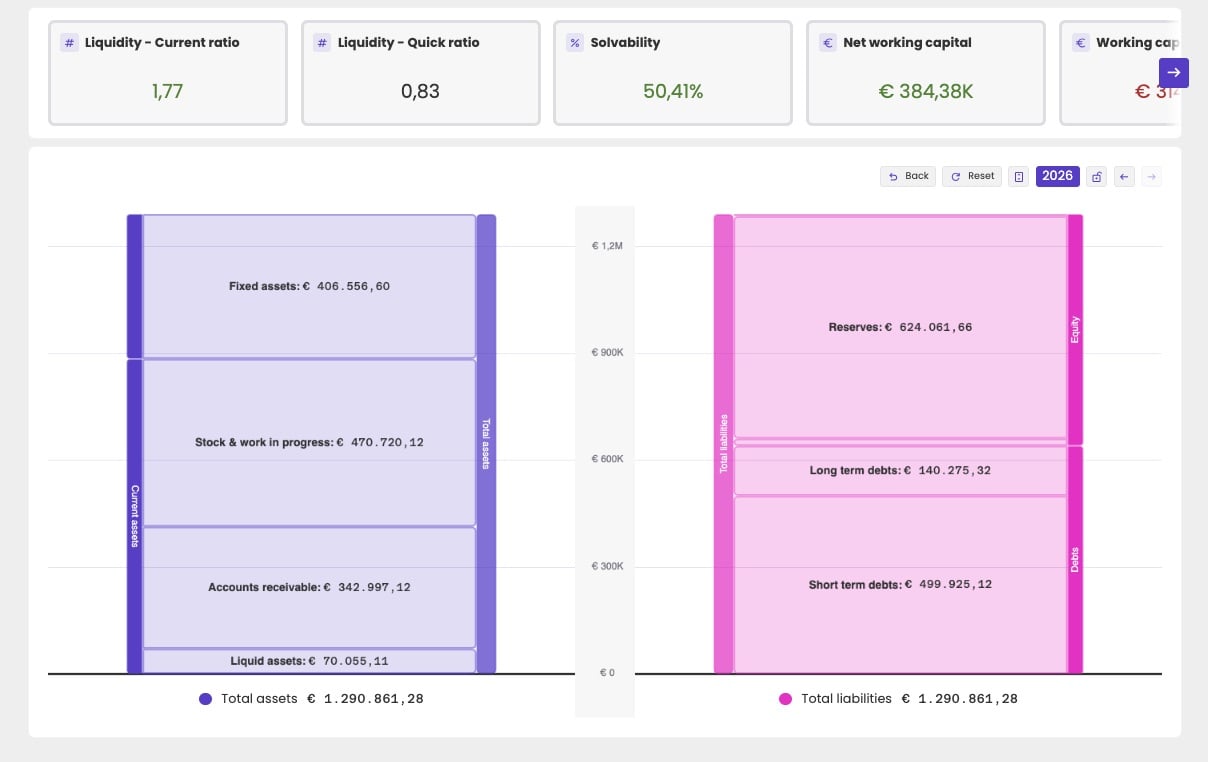
Balance sheet visual drilled down: current assets split into stock and work in progress, accounts receivable and liquid assets; equity shown as reserves; debts split into long-term and short-term debts

Current assets and liabilities, drilled down one level.

  • Back goes up one level.
  • Reset goes back to the top level.
  • The arrows at the top right switch between years.

Ratios

KPI cards at the top show the main balance sheet ratios:
  • Liquidity - Current ratio
  • Liquidity - Quick ratio
  • Solvability
  • Net working capital
  • Working capital needs
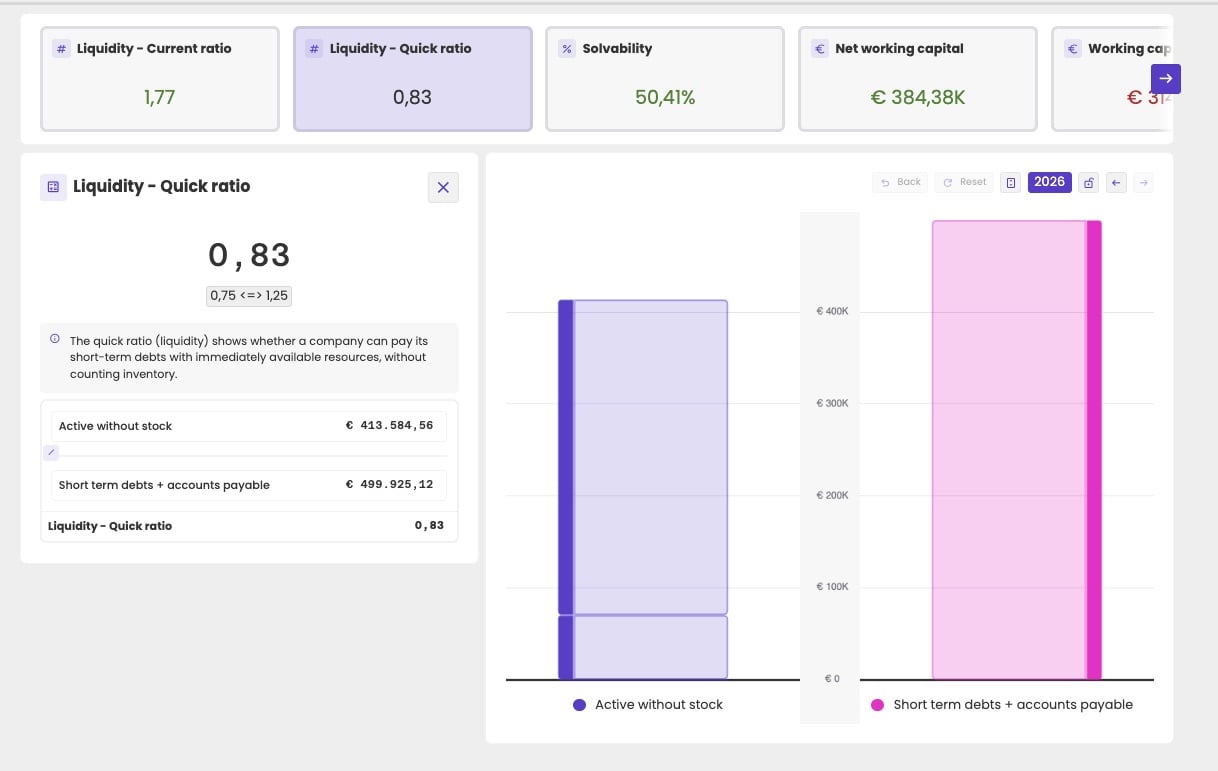
Click a card to see how the ratio is calculated for this administration. A panel shows the value, a short explanation and the formula with its components. The chart then shows the blocks used in the calculation.
Balance sheet visual with the Liquidity quick ratio card selected; a panel shows the value 0.83, the range 0.75 to 1.25, an explanation, and the calculation of active without stock divided by short-term debts plus accounts payable; the chart shows both amounts as blocks

The quick ratio: assets without stock divided by short-term debts and accounts payable.

The range below the value is the normal range for that ratio, for example 0.75 to 1.25 for the liquidity ratios, or 20% to 35% for solvability. Below the range is weak, above it is strong. The Administration score uses the same ranges. For the definitions of all ratios, see the ratio reference.