The KPI cards at the top of the administration dashboard come from a KPI dashboard template: a set of KPIs to show. aiGust provides a Default dashboard. As a key user, you can add templates of your own that everyone at your firm can use, for example one for construction companies with the KPIs that matter most in that sector.
Only key users can manage firm-wide templates.

The templates overview

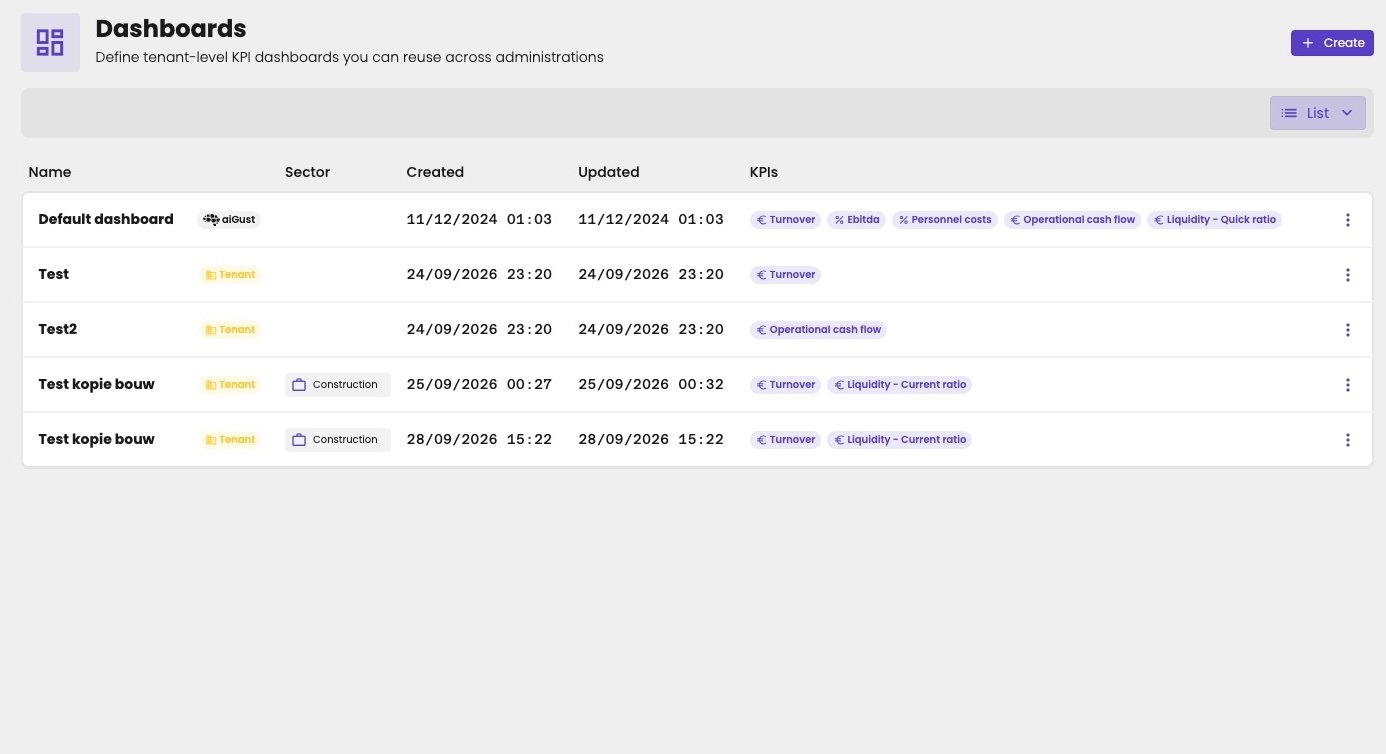
Click Settings in the main rail, and choose KPI dashboards. For each template, the list shows:
  • Name, with a badge: aiGust for the default dashboard, Tenant for your firm’s own templates.
  • Sector, if the template is linked to one.
  • Created and Updated.
  • KPIs, the KPIs the template shows.
Dashboards page, to define tenant-level KPI dashboards you can reuse across administrations, with a Create button and a List switch. Five dashboards: Default dashboard with the aiGust badge, and Test, Test2 and two Test kopie bouw with the Tenant badge. The Test kopie bouw dashboards are linked to the sector Construction. The KPIs column lists each dashboard's KPIs, such as Turnover, Ebitda and Liquidity - Quick ratio.

The KPI dashboard templates of a firm.

Create a template

Click Create. In the Dashboard configuration panel:
1

Name the dashboard

Enter a Name. Your colleagues see it when they choose the dashboard of an administration.
2

Link it to a sector, optionally

Turn on Is sector specific dashboard, and choose the sector. Administrations in that sector then get this template automatically. See Which dashboard an administration shows.
3

Add the KPIs

Under Selected KPIs, click Add column for each KPI, and choose the KPI in the same way as in a trigger.
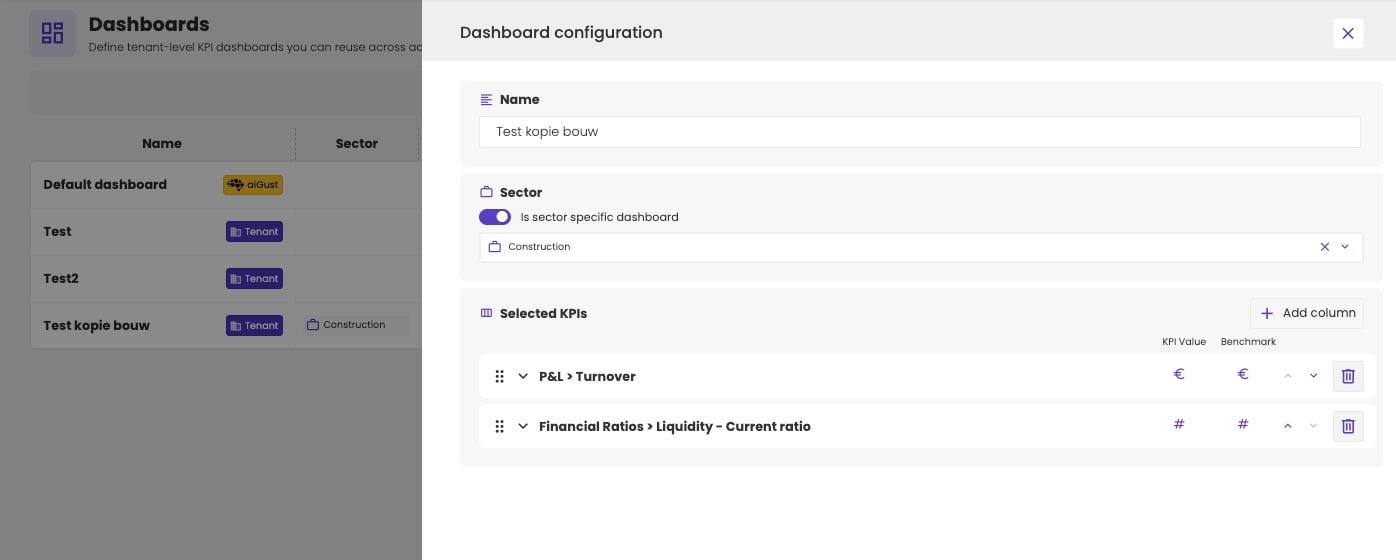
Dashboard configuration panel with the name Test kopie bouw, Is sector specific dashboard turned on with the sector Construction, and two selected KPIs: P&L > Turnover and Financial Ratios > Liquidity - Current ratio, each with a KPI Value and a Benchmark type.

A dashboard for construction companies, with two KPIs.

To change the order of the KPIs, drag them, or use the arrows. Click the bin to remove a KPI. To edit or delete a template later, click the three dots at the end of its row in the overview.

Choose what each KPI card shows

Click the arrow next to a KPI to open its settings:
  • KPI: the KPI itself. Click the pencil to choose another one.
  • KPI Value: the KPI type of the main number on the card. The card always shows the change compared with last year next to it.
  • Benchmark: the KPI type of the benchmark below the main number.
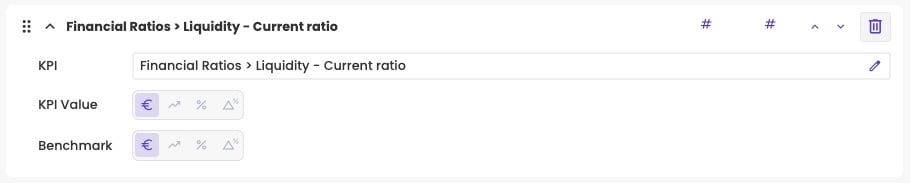
The settings of Financial Ratios > Liquidity - Current ratio, with a KPI field and a pencil to change it, and a row of KPI type icons for KPI Value and for Benchmark.

The settings of one KPI.

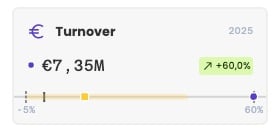
The main number and the benchmark don’t need the same KPI type. For turnover, for example, show the absolute turnover as the main number, and benchmark the growth. The benchmark of the growth tells you whether most peers grew, which the benchmark of absolute turnover can’t. See KPI types in benchmarking.
KPI card Turnover 2025 with the value €7.35M and +60.0%, and below it a benchmark from -5% to 60% with the median as a square and the administration's growth as a dot.

Turnover as an amount, with the benchmark of its growth: the peers range from −5% to 60%.

Which dashboard an administration shows

When someone chooses a dashboard for an administration, aiGust remembers it for that administration, for everyone at your firm. See Choose the KPI dashboard. Until then, aiGust picks the most suitable dashboard, in this order:
  1. A dashboard made for that administration.
  2. A firm-wide template, the closest match first:
    1. one linked to the administration’s sector;
    2. one without a sector;
    3. any other firm-wide template.
  3. An aiGust dashboard, matched in the same way. Today, that’s the Default dashboard.
So a choice made for the administration always wins. Then come the administration’s own dashboards, then your firm’s templates, then aiGust’s.
If two dashboards match at the same step, there’s no rule to decide between them. That happens with two dashboards made for the same administration, two templates for the same sector, or two templates without a sector. An administration without a chosen dashboard can then show either. So keep the number of templates small, link them to a sector where you can, and give each sector only one template.