See how aiGust is adopted at your firm and by your clients. Click Usage in the main rail. Adoption & usage opens, with three sections: Users, Meetings and Forecasts.
Only key users see Usage.
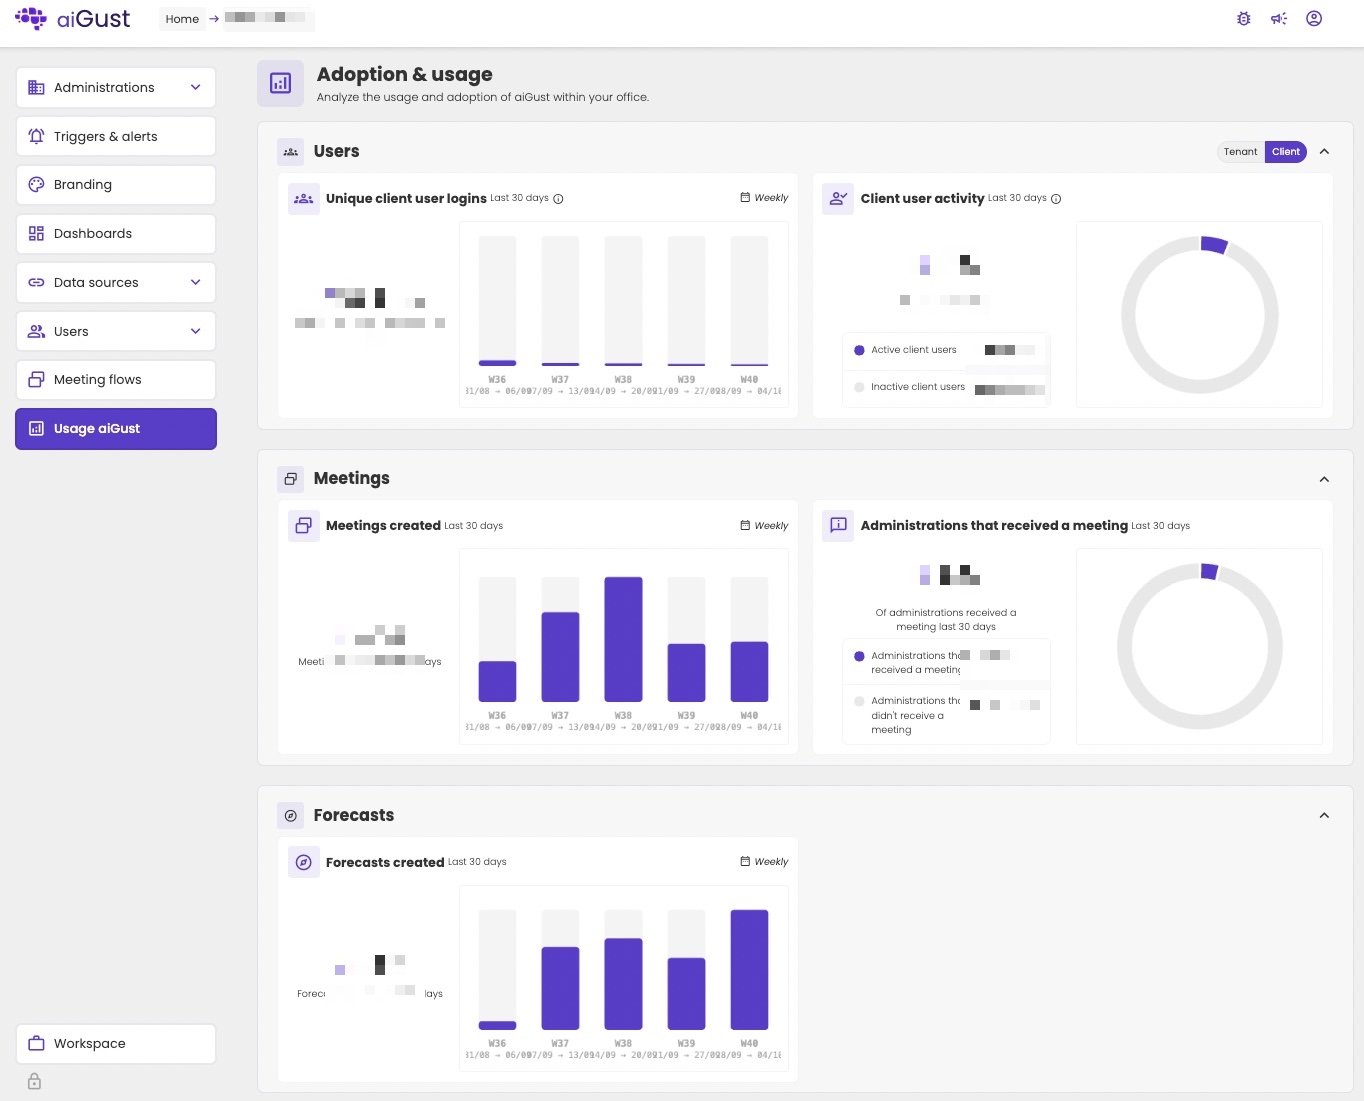
Adoption & usage page with three sections, with the figures blurred. Users, set to Client with the Tenant / Client switch: Unique client user logins in the last 30 days, with a weekly bar chart, and Client user activity with the share of active and inactive client users and a ring chart. Meetings: Meetings created, with a weekly bar chart, and Administrations that received a meeting, with a ring chart. Forecasts: Forecasts created, with a weekly bar chart.

The adoption and usage of aiGust, here for client users.

Click a card to open its detail page, with a chart and, for most of them, a list you can search and download with Export Excel. Click Back to return.

Choose the period

Every card and detail page shows the Last 30 days by default. On a detail page:
  • click the period at the top right, and choose Last 7 days up to Last 365 days, or pick a start and end date in the calendar;
  • move to the previous or next period with the arrows.
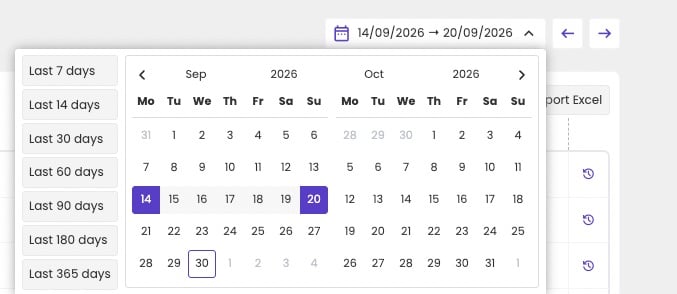
Period picker opened, with the options Last 7 days, Last 14 days, Last 30 days, Last 60 days, Last 90 days, Last 180 days and Last 365 days on the left, and a calendar for September and October 2026 with 14 to 20 September selected.

Choose the period.

The charts show one bar per week. Click Weekly to choose Daily, Monthly, Quarterly or Complete period instead.
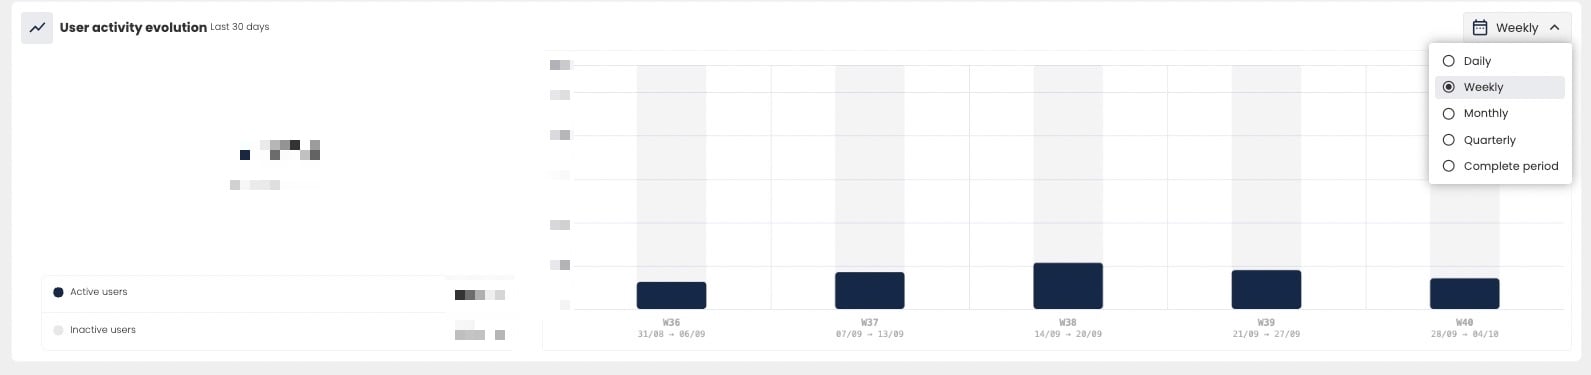
User activity evolution chart, with the figures blurred, and the Weekly menu opened, showing Daily, Weekly (selected), Monthly, Quarterly and Complete period.

Group the chart per day, week, month or quarter.

Users

Use the switch at the top right of Users to see the users at your firm (Tenant) or your client users (Client). The reports are the same. Usage is usually higher at your firm than at your clients.
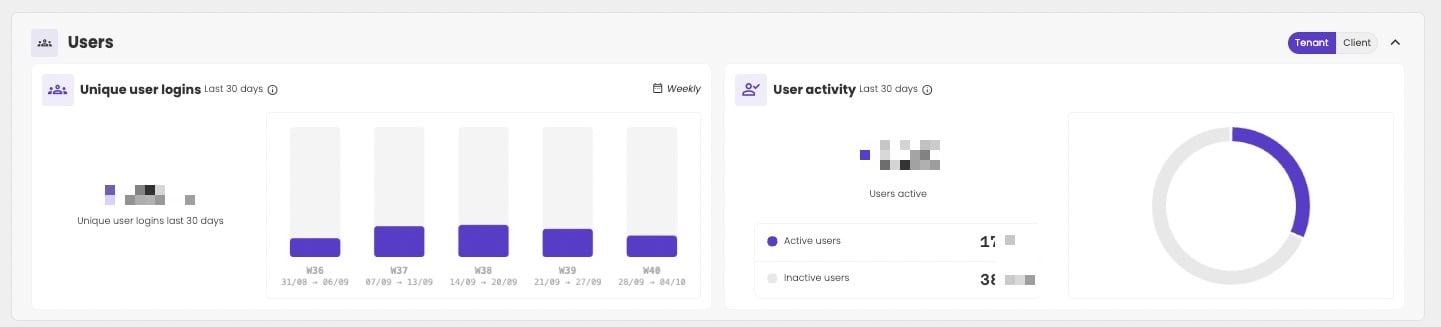
Users section set to Tenant, with the figures blurred: Unique user logins in the last 30 days with a weekly bar chart, and User activity with active and inactive users and a ring chart.

The users at your firm.

Unique user logins

How many different users signed in during the period, out of all users. A user who signs in ten times counts once. Click the card to see the evolution. Click a bar in the chart to see who signed in during that period, with their Most recent login.
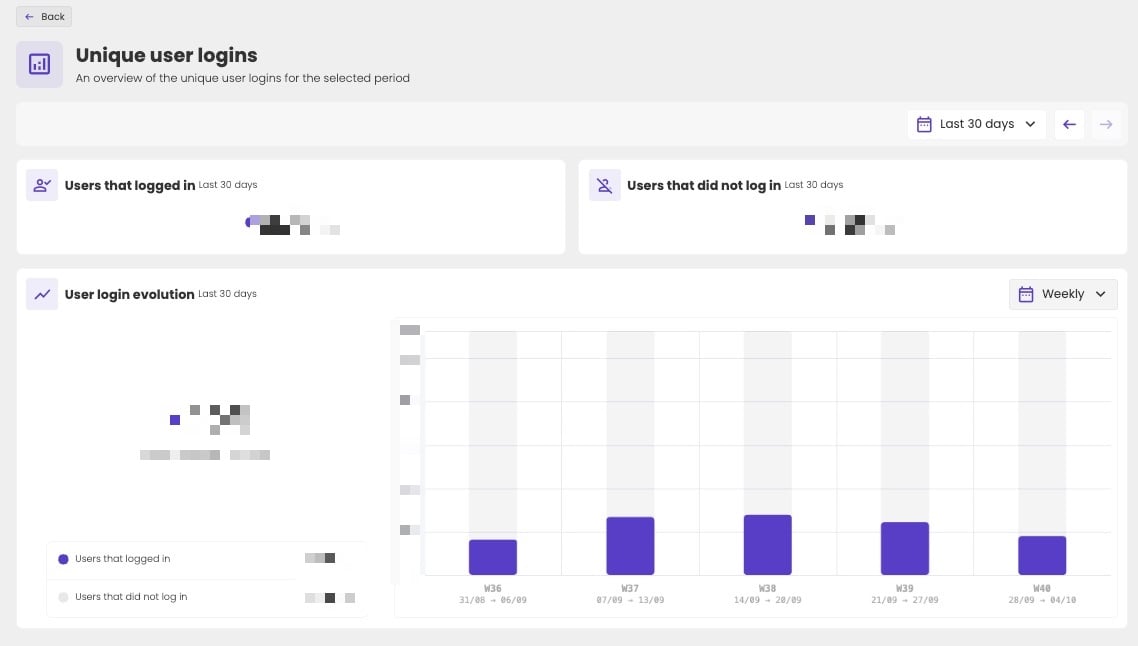
Unique user logins page with a Back button and the period Last 30 days, with the figures blurred: Users that logged in, Users that did not log in, and User login evolution with a weekly bar chart from W36 to W40.

How many users signed in, per week.

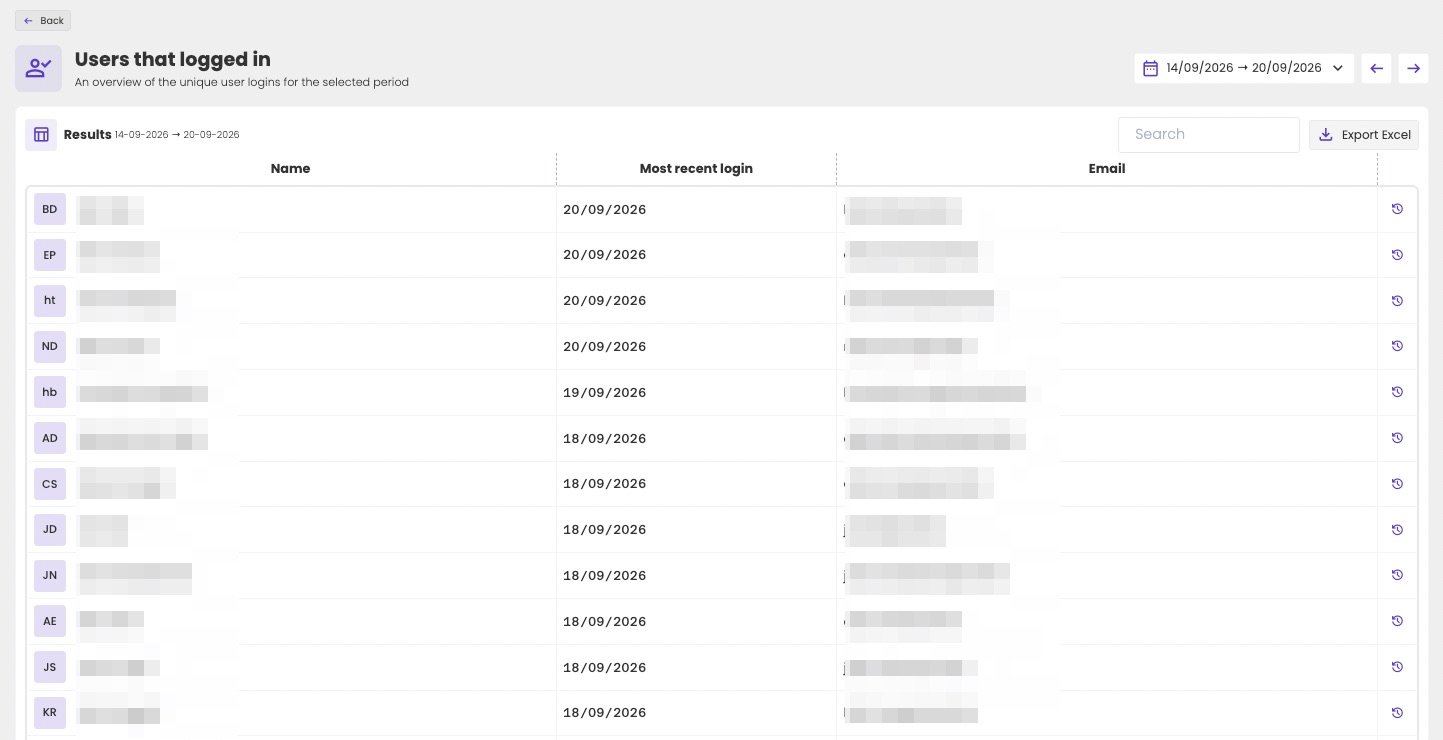
Users that logged in page for 14/09/2026 to 20/09/2026, with Search and Export Excel. The Results table lists users with their initials, a blurred name, their Most recent login, such as 20/09/2026, a blurred email address and a history icon.

Who signed in during one week.

User activity

How many users were active during the period. Signing in isn’t enough:
  • A user at your firm is active after doing at least one thing, such as creating a meeting.
  • A client user is active after viewing a meeting.
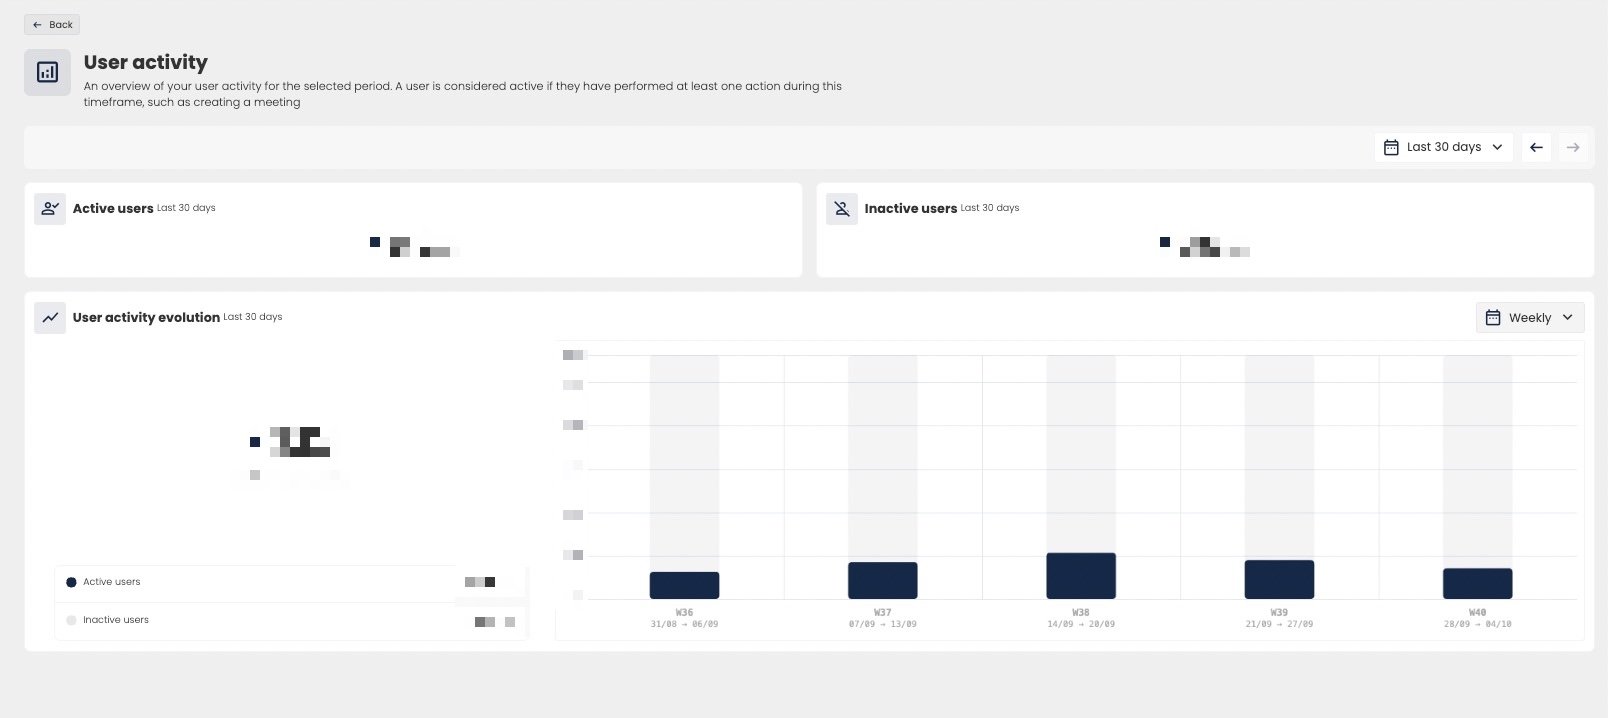
Click the card to see the evolution, and the list of active users with their most recent activity.
User activity page, explaining that a user is considered active if they have performed at least one action during this timeframe, such as creating a meeting. Active users, Inactive users and User activity evolution with a weekly bar chart from W36 to W40, with the figures blurred.

How many users at your firm were active.
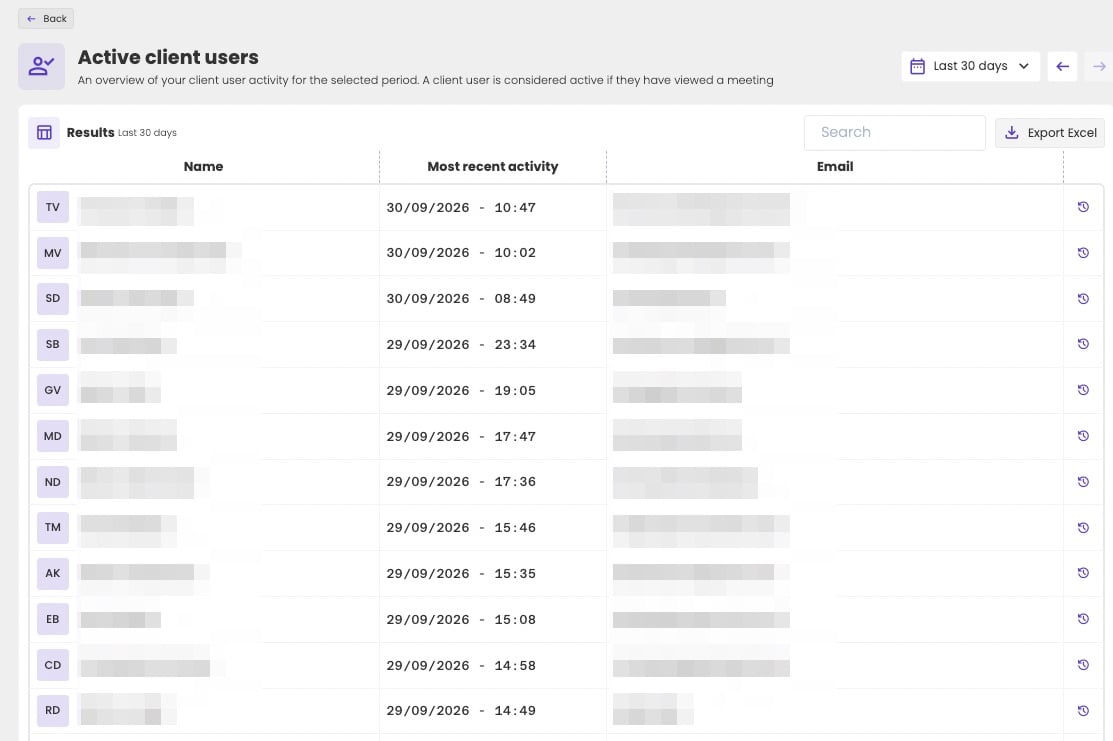
Active client users page with the period Last 30 days, a Search field and an Export Excel button. The Results table lists client users with their initials, a blurred name, their most recent activity, such as 30/09/2026 - 10:47, a blurred email address and a history icon.

The active client users, with their most recent activity.

In every list of users, click the history icon next to someone to open their audit log: what they did, per day and per administration.

Meetings

Meetings created

How many meetings your firm created in the period, whether or not you published them. The list shows each meeting’s Title, Administration, VAT Number, when it was Created and who created it.
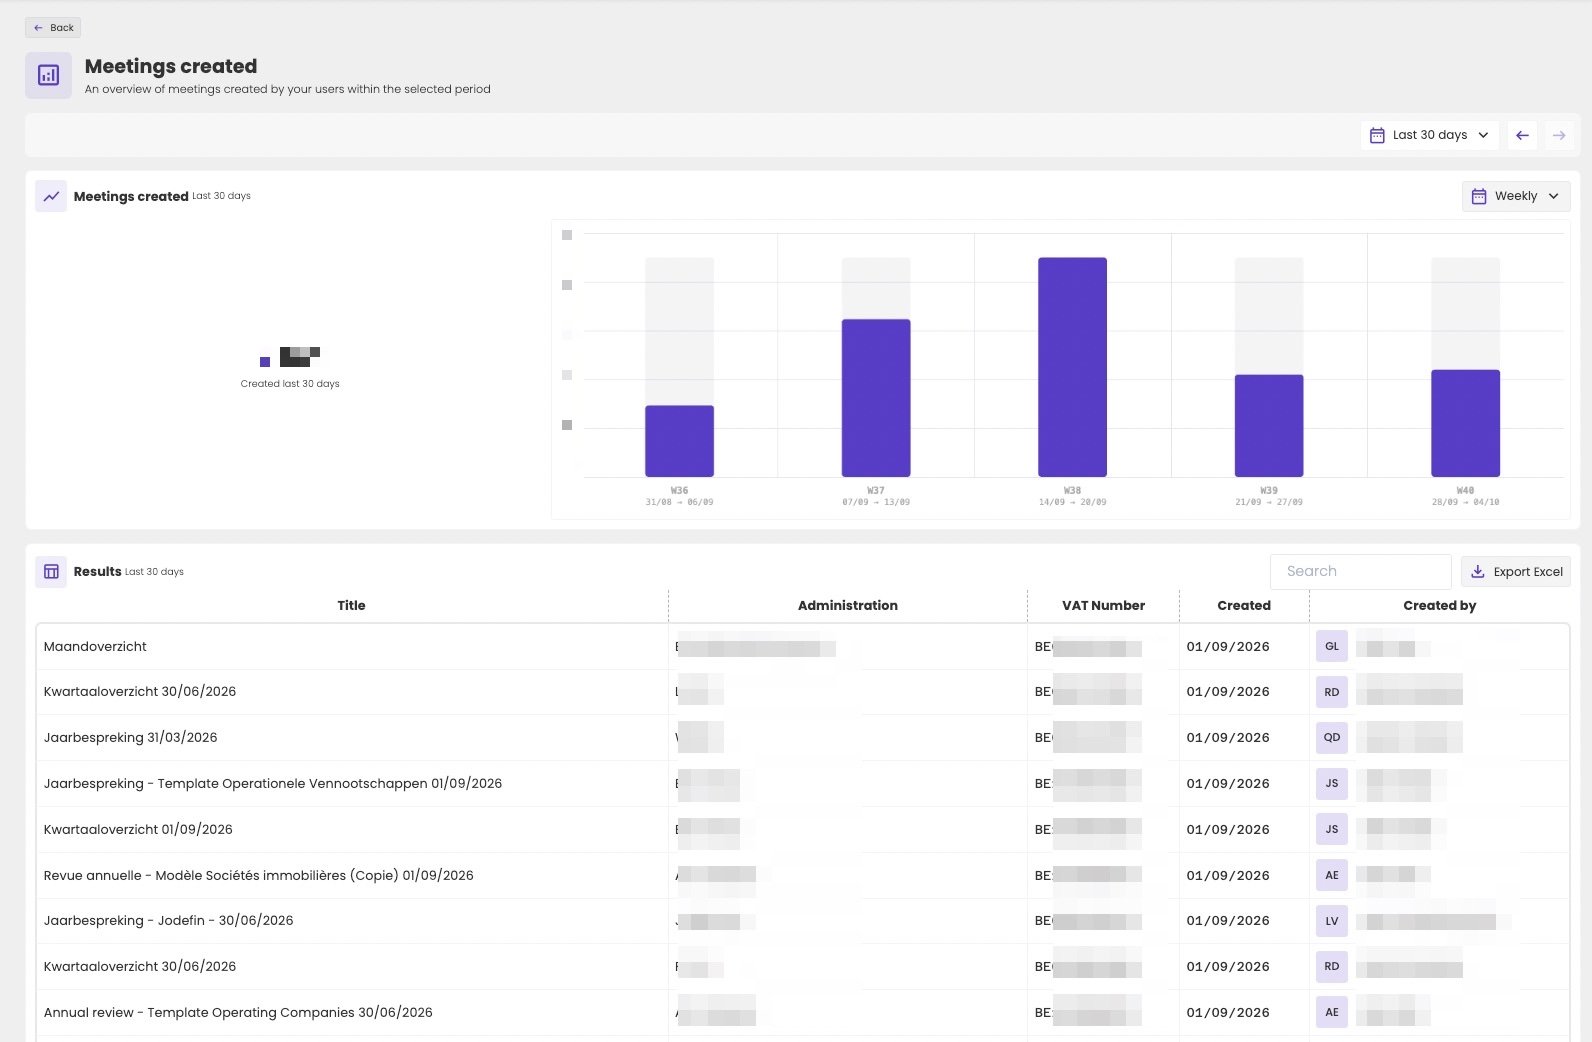
Meetings created page for the last 30 days, with the total blurred and a weekly bar chart from W36 to W40. Below, a Results table with Search and Export Excel, and the columns Title, Administration, VAT Number, Created and Created by. Titles include Maandoverzicht, Kwartaaloverzicht 30/06/2026, Jaarbespreking 31/03/2026 and Annual review - Template Operating Companies 30/06/2026. Administrations, VAT numbers and names are blurred.

The meetings your firm created.

Administrations that received a meeting

How many of your administrations got a meeting in the period, out of all administrations. The list shows each administration, when its meeting was created and last updated, and the Meeting Author. Use it to see how widely your firm advises its clients: a meeting for most administrations, or many meetings for only a few.
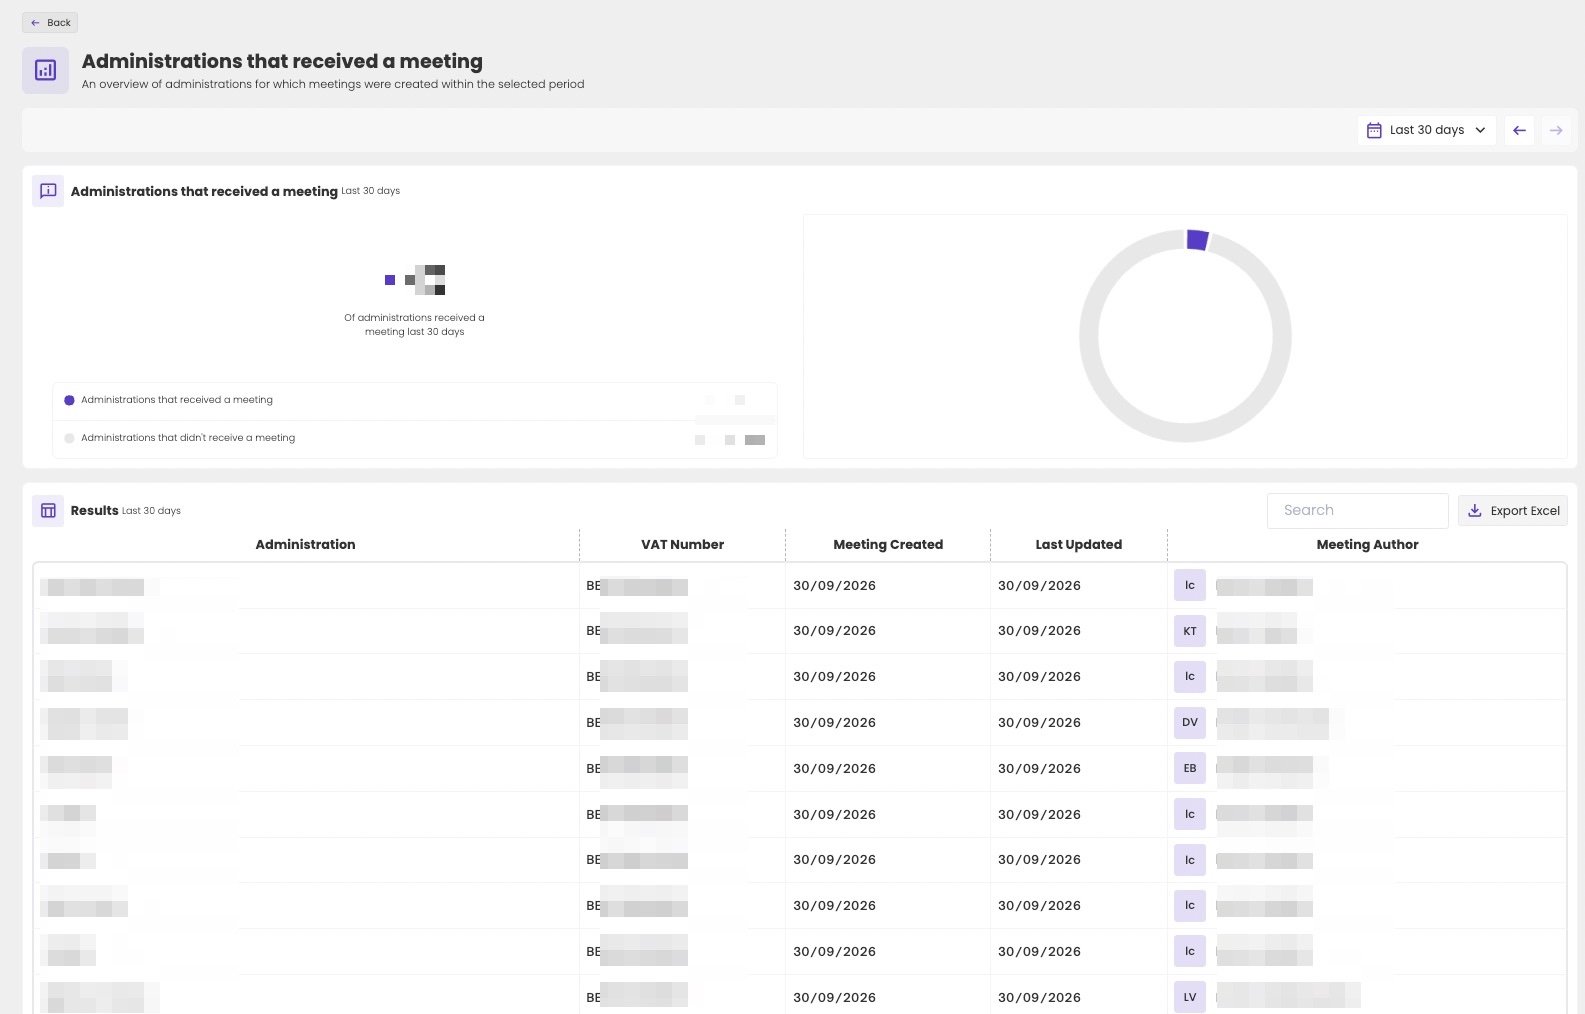
Administrations that received a meeting page for the last 30 days, with the share and counts blurred and a ring chart. Below, a Results table with Search and Export Excel, and the columns Administration, VAT Number, Meeting Created, Last Updated and Meeting Author, with blurred administrations and authors.

The administrations that got a meeting.

Forecasts

Forecasts created

How many forecasts your firm created in the period. The list shows each forecast’s Title, Administration, when it was Created and who created it. See Forecasts.
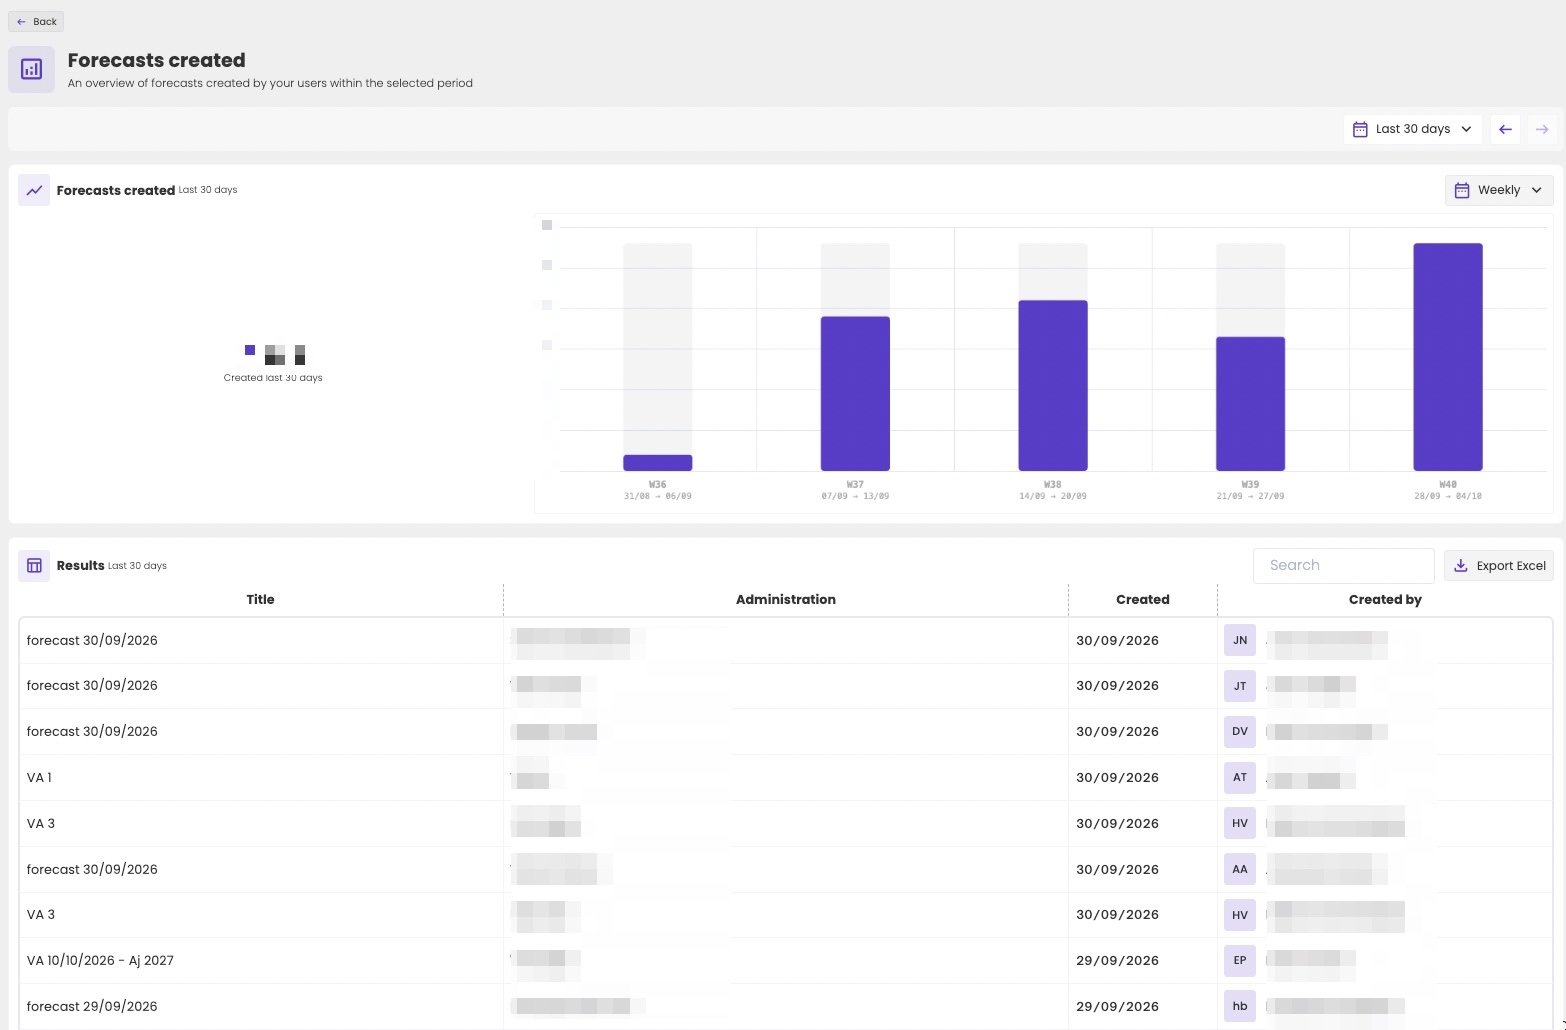
Forecasts created page for the last 30 days, with the total blurred and a weekly bar chart from W36 to W40. Below, a Results table with Search and Export Excel, and the columns Title, Administration, Created and Created by. Titles include forecast 30/09/2026, VA 1, VA 3 and VA 10/10/2026 - Aj 2027. Administrations and names are blurred.

The forecasts your firm created.

Client users can’t open or create forecasts in the client portal. They only see the forecast you activated for the administration, in their charts and reports. The best way to share a forecast with your client is to add it to a meeting.