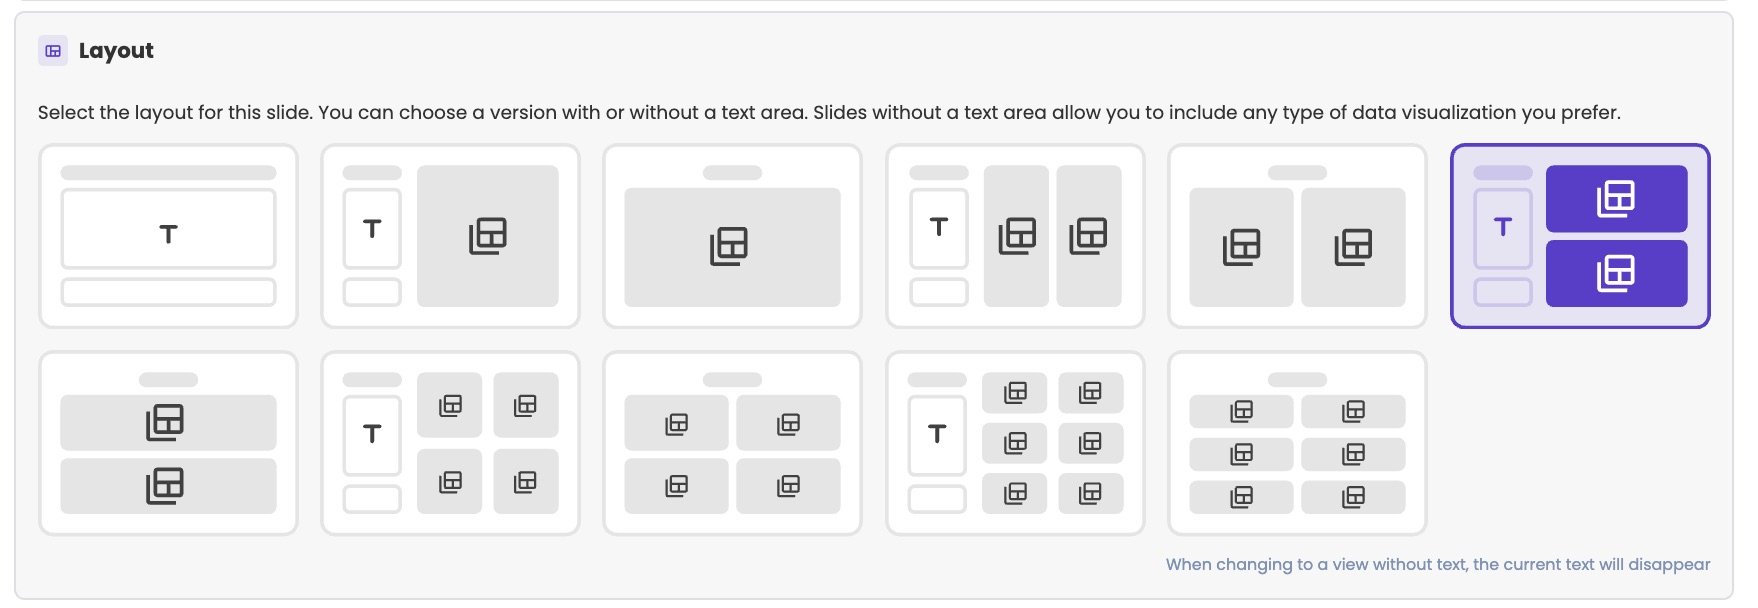
Every slide in a meeting has a layout. The layout divides the slide into zones: a text zone, data zones, or both. You can’t place things freely, as in PowerPoint. It works more like a photo book: you choose a page layout, then fill in the zones.

Choose the layout

  1. Open the slide in the meeting editor.
  2. Click Layout & time period above the canvas.
  3. Under Layout, choose a layout.
  4. Fill in the zones.
Eleven slide layouts: only text; text with one data zone; one data zone; text with two data zones side by side; two data zones side by side; text with two data zones stacked; two data zones stacked; text with four data zones; four data zones; text with six data zones; six data zones.

The eleven layouts. T marks the text zone.

The layouts come in pairs: with a text zone on the left, or without. When you switch to a layout without a text zone, the text of the slide disappears.

Match the layout to the widget

You can put any widget in any data zone: aiGust doesn’t check whether it fits. But not every widget works in every zone. A financial table, such as the full P&L, doesn’t fit in a small card. A KPI card does. With a text zone, the data zones are smaller, so fewer widgets look good in them.
  • Use one data zone for tables, such as the P&L or the Balance, and for external documents.
  • Use four or six data zones for KPI cards and scores.
  • Check the slide before the meeting. The canvas shows the real figures, so you see right away whether everything fits.

Titles and text

Click the text zone on the canvas to change the title, the navigation name and the text of the slide. See Titles and text on a slide.

Data widgets

Click a data zone on the canvas to open Zone configuration. Under Widget, choose a widget, such as a report, a chart or a score, click Apply, and set its options. See Widgets for every widget and its options.