Shows one KPI as a number, with its change compared with last year. Like the KPI cards on the administration dashboard, it can show the benchmark of the peer group. See Benchmarks in KPI cards.

Options

Under Display options: The number and the benchmark don’t need the same KPI type. For turnover, for example, show the amount, and benchmark the growth. See KPI types in benchmarking.
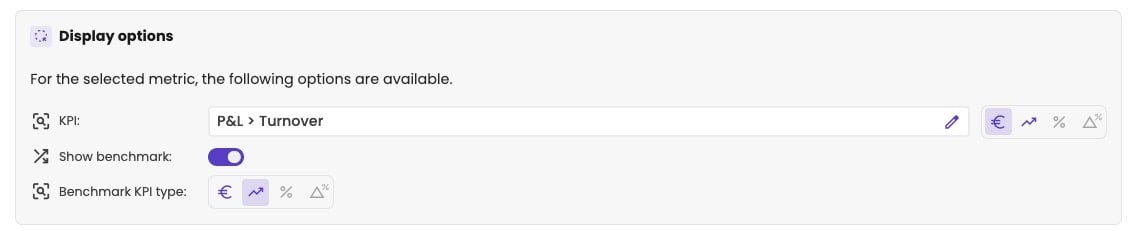
Display options with KPI P&L > Turnover, a pencil, the KPI type icons with the amount selected, Show benchmark turned on, and Benchmark KPI type with the growth selected.

The options of the KPI card.

Where it fits

A small zone. Use a layout with four or six data zones to show several KPI cards together.
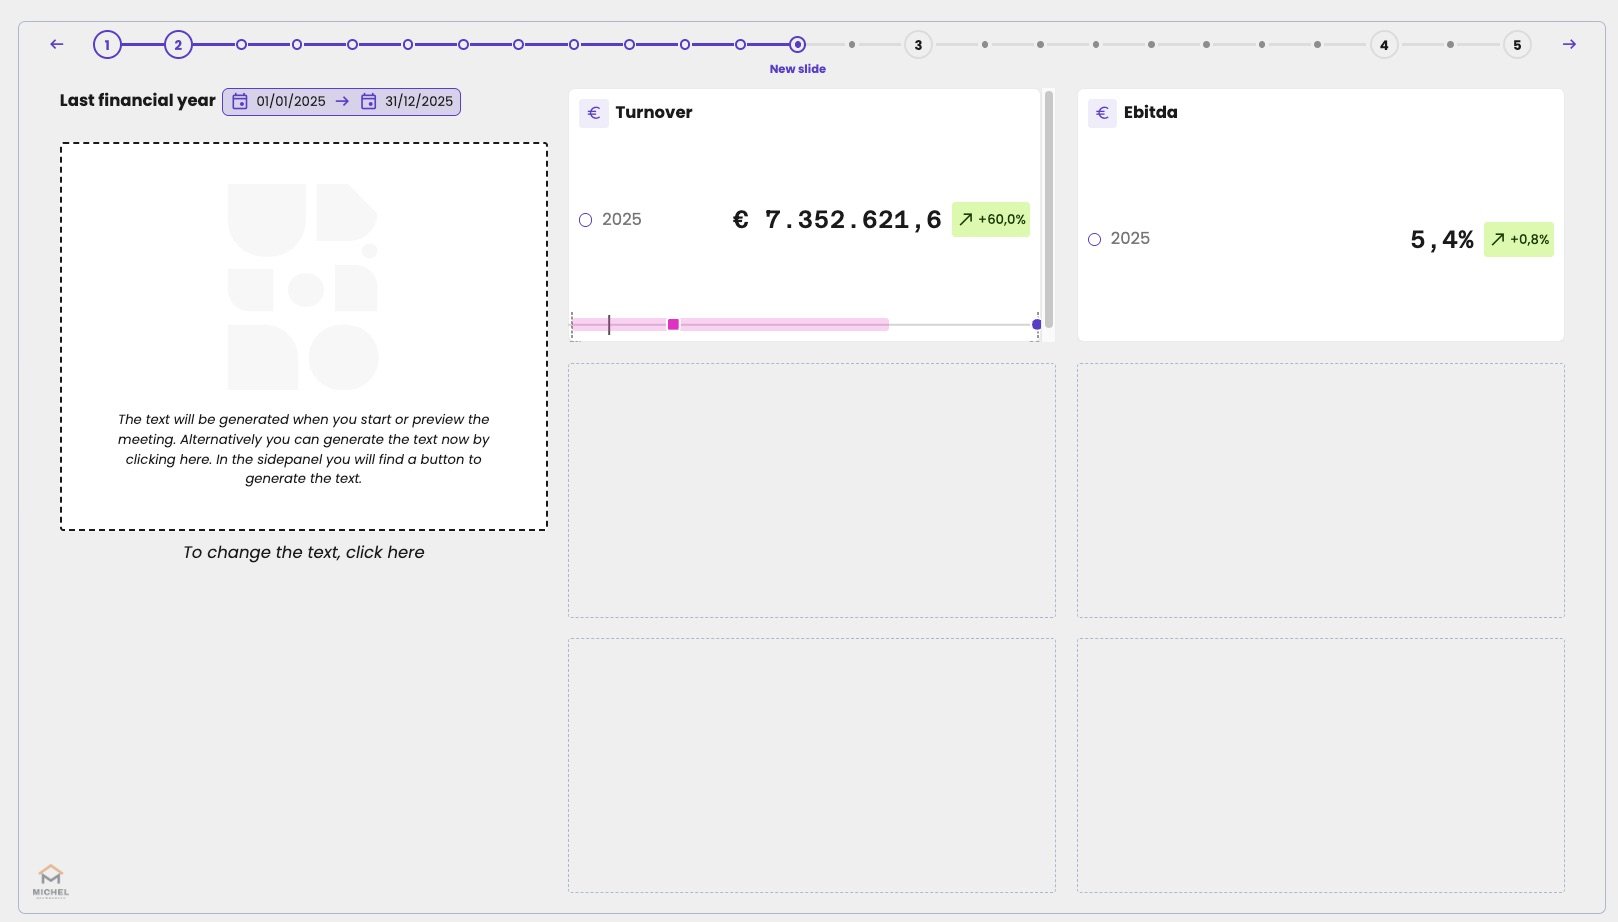
A slide for Last financial year 01/01/2025 to 31/12/2025 with an AI text zone on the left and six data zones on the right. Two hold KPI cards: Turnover 2025 €7,352,621.6 (+60.0%) with a benchmark bar below it, and Ebitda 2025 5.4% (+0.8%) without a benchmark. The other four zones are empty.

Two KPI cards next to a text zone: Turnover with the benchmark, Ebitda without.