The standard reports, such as the profit and loss and the balance sheet, are the same for every administration. With management reports, you build your own. You decide how the accounts are grouped, how the lines add up, and which results aiGust calculates. A typical example: a profit and loss for a restaurant that shows food and beverages separately, each with its own costs and its own margin. Click Management reports under Financials in the administration menu. An administration can have as many management reports as you like. They live next to the standard reports, and don’t change them. The list shows each report with its source:
  • Administration: a report of this administration only.
  • Tenant, with Read only: a report from your firm’s library, linked to this administration. See Use a report from the library.
Management reports page, to create and manage custom reports, with a Create button and a List switch. Three reports with their type, description, updated and created date: Bart's best report and Demo Friday, marked Administration, and P&L default [COPY], marked Read only and Tenant.

The management reports of an administration.

How a report is built

A management report is a set of rows, organised in groups. Each group is one of three types: At the lowest level, every report comes down to GL accounts, selected by line items. The report only defines the rows. The columns, such as the financial year or year to date, depend on the view you choose, as in the standard reports. See Financial table. You build the rows in the editor.

Create a management report

  1. Click Create.
  2. Choose how to start:
    • Start from scratch: an empty report, that you build yourself.
    • Copy an existing report: under Report to copy, choose any report: an aiGust standard report, such as P&L default or Balance active, a report from your firm’s library (Tenant), or a report of an administration. You then change the copy as you like.
    • Link a tenant template: under Template to link, choose a report from your firm’s library. You can’t change it here. See Use a report from the library.
  3. Click Next.
  4. Enter a Title, and optionally a Description, in each language: NL, EN and FR. Click Translate to translate them into the other languages automatically.
  5. Click Create.
Create management report dialog with the options Start from scratch, Copy an existing report (selected) and Link a tenant template. The Report to copy list is open: Balance active, Balance passive, Cash flow, P&L default and P&L fix/var marked aiGust, P&L default [COPY] marked Tenant, and Demo Friday and Bart's best report marked Administration.

Copy an existing report: from aiGust, from your firm's library or from an administration.

Create management report dialog with Link a tenant template selected, described as: changes at tenant level are applied automatically, local edits are not possible. The Template to link list is open, with P&L default [COPY] marked Tenant.

Link a tenant template: only the reports of your firm's library.
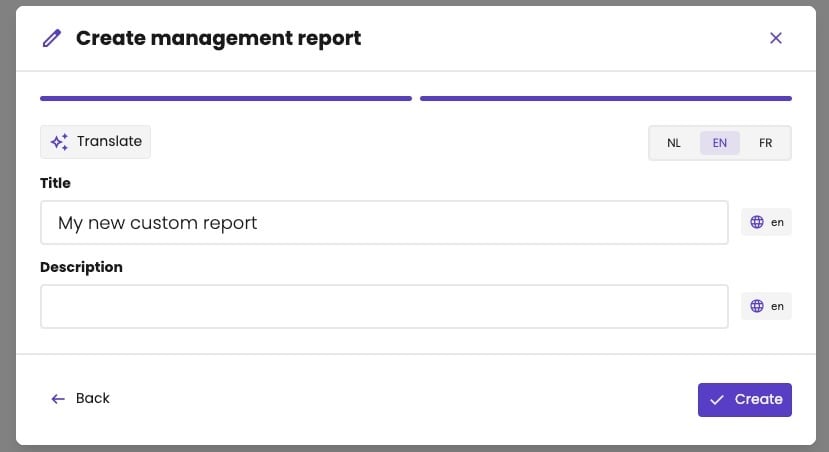
Create management report dialog, step 2, with a Translate button and the language buttons NL, EN (selected) and FR. Title My new custom report, an empty Description, and the buttons Back and Create.

Step 2: the title and the description, in each language.

A linked report also gets its own title in the administration. Use the library title, so you recognise the report later. Then build the report in the editor. Everyone who can edit the administration can create, change and delete its management reports.

Use a report from the library

Your firm can keep a library of management reports, so you don’t build the same report for every administration. See Management report library. When you create a report from a library report, you choose how: Copy an existing report or Link a tenant template. Choose Link for a report that must look the same everywhere. Choose Copy when one administration needs its own variant.

Use a management report in a meeting

  1. In the meeting editor, add the Management report widget to a slide.
  2. Choose the report.
The list only shows the reports of this administration: its own reports, and the library reports linked to it. A meeting flow can also show a library report on a slide, or leave the choice to you in each meeting. See In a meeting flow.

Use a line as a KPI on the dashboard

Any line of a management report can be a KPI card on the dashboard.
  1. On the administration’s Overview, click Edit KPI dashboard. See Customise the dashboard.
  2. Under Selected KPIs, click Add column.
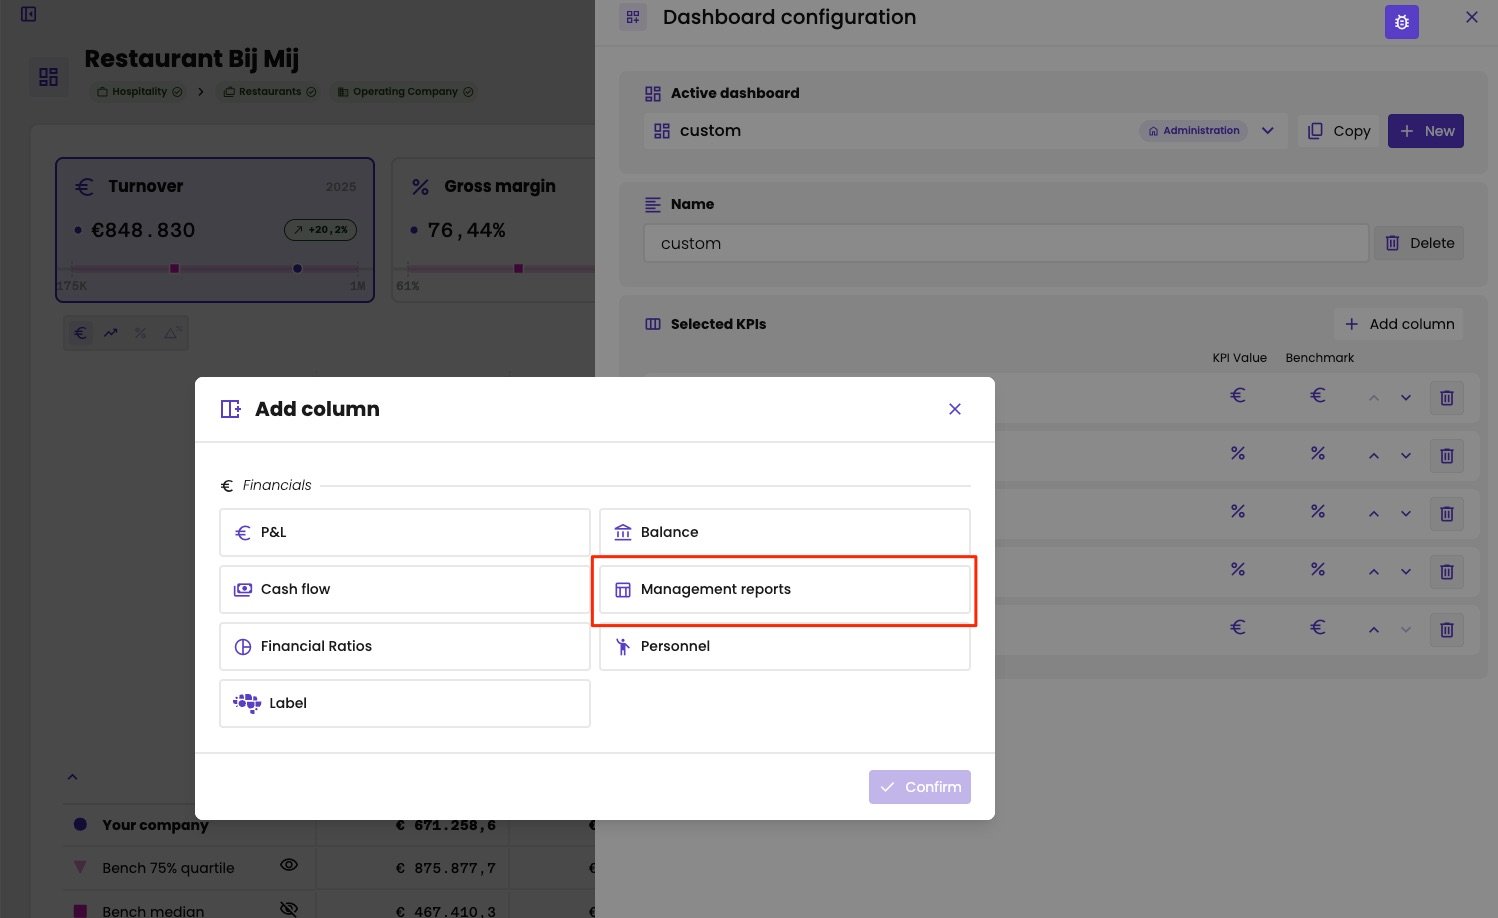
  3. Under Financials, choose Management reports.
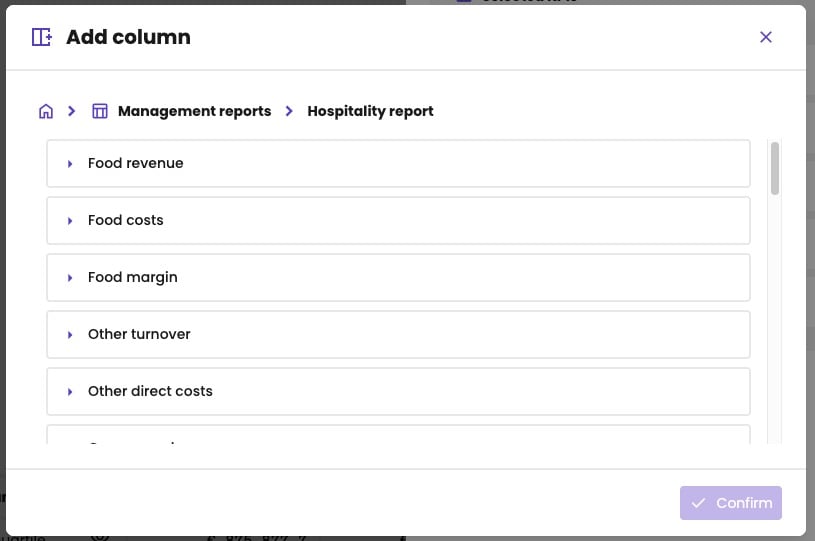
  4. Choose a report, and browse it like a profit and loss: click the arrow in front of a group to open it.
  5. Choose the line, and click Confirm.
The Dashboard configuration panel of Restaurant Bij Mij, with the active dashboard custom and Selected KPIs. In front of it, the Add column dialog with under Financials: P&L, Balance, Cash flow, Management reports (marked in red), Financial Ratios, Personnel and Label. A Confirm button.

Under Financials, choose Management reports.

The Add column dialog at Management reports › Hospitality report, with the groups Food revenue, Food costs, Food margin, Other turnover and Other direct costs, each with an arrow to open it. A Confirm button.

Choose a line of the report.

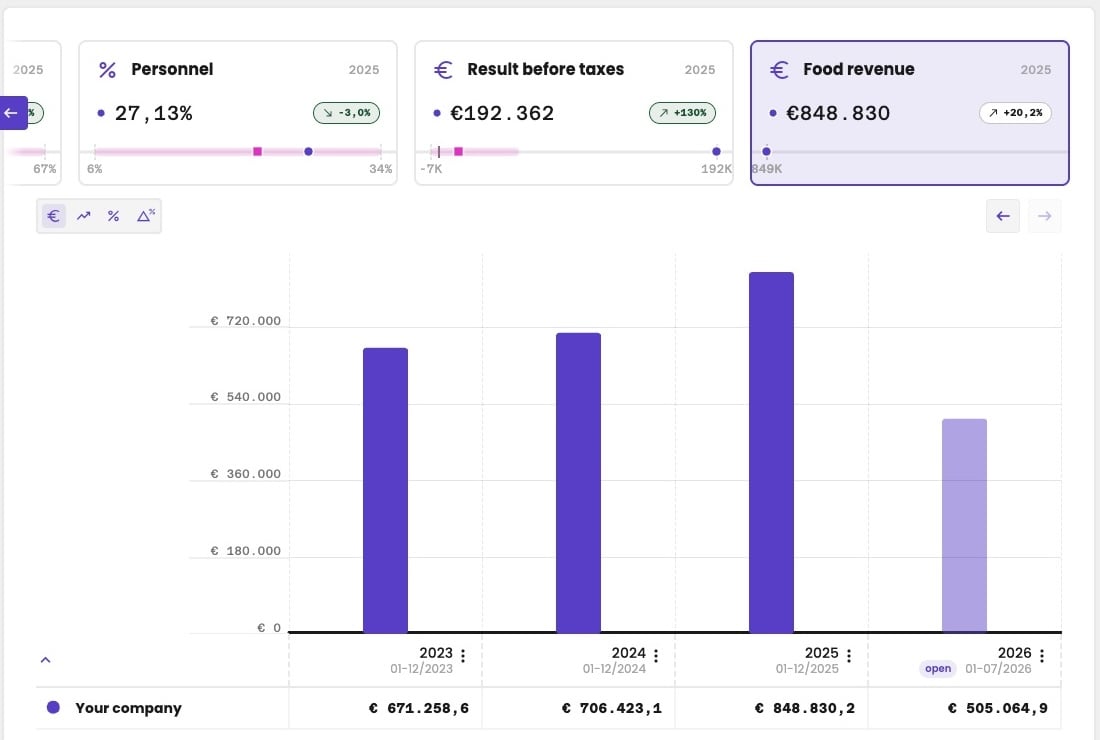
Management reports are your own reports, so there are no benchmarks for them. The card shows the value and its growth, but no benchmark.
The KPI cards of an administration: Personnel 27,13% and Result before taxes €192.362, each with a benchmark bar, and Food revenue 2025 €848.830 with +20,2%, selected, with only the administration's own value on its bar. Below, the chart of Food revenue for 2023 to 2026, with €671.258,6, €706.423,1, €848.830,2 and €505.064,9 for 2026, open until 01-07/2026.

Food revenue from the Hospitality report as a KPI card, without a benchmark, next to standard KPIs.

You can only choose a report of this administration: one created for it, or a library report linked to it. So you add these KPIs on the dashboard of one administration, not in a firm-wide template. When a KPI can no longer be found, for example because you deleted its report, the dashboard shows KPI not found instead of the card. aiGust never removes these cards itself: click Remove to take the KPI off the dashboard.
Three KPI cards: Food revenue 2025 €848.830, then a dashed card KPI not found, This KPI no longer exists or is not available for this administration, with a Remove button, then Turnover 2025 €848.830 with a benchmark bar.

The KPI of a deleted report.

You can’t use management report lines in triggers or benchmarks yet.

Rename, download or delete a report

Open the report, and click the three dots at the top right:
  • Rename: change the title.
  • Download definition: download the definition of the report as a JSON file. Exporting to PDF or Excel isn’t available yet.
  • Delete: delete the report.