Open a management report to see its two tabs:
  • Table: the report with its figures, like a standard report.
  • Definition: the editor, where you build the rows of the report.
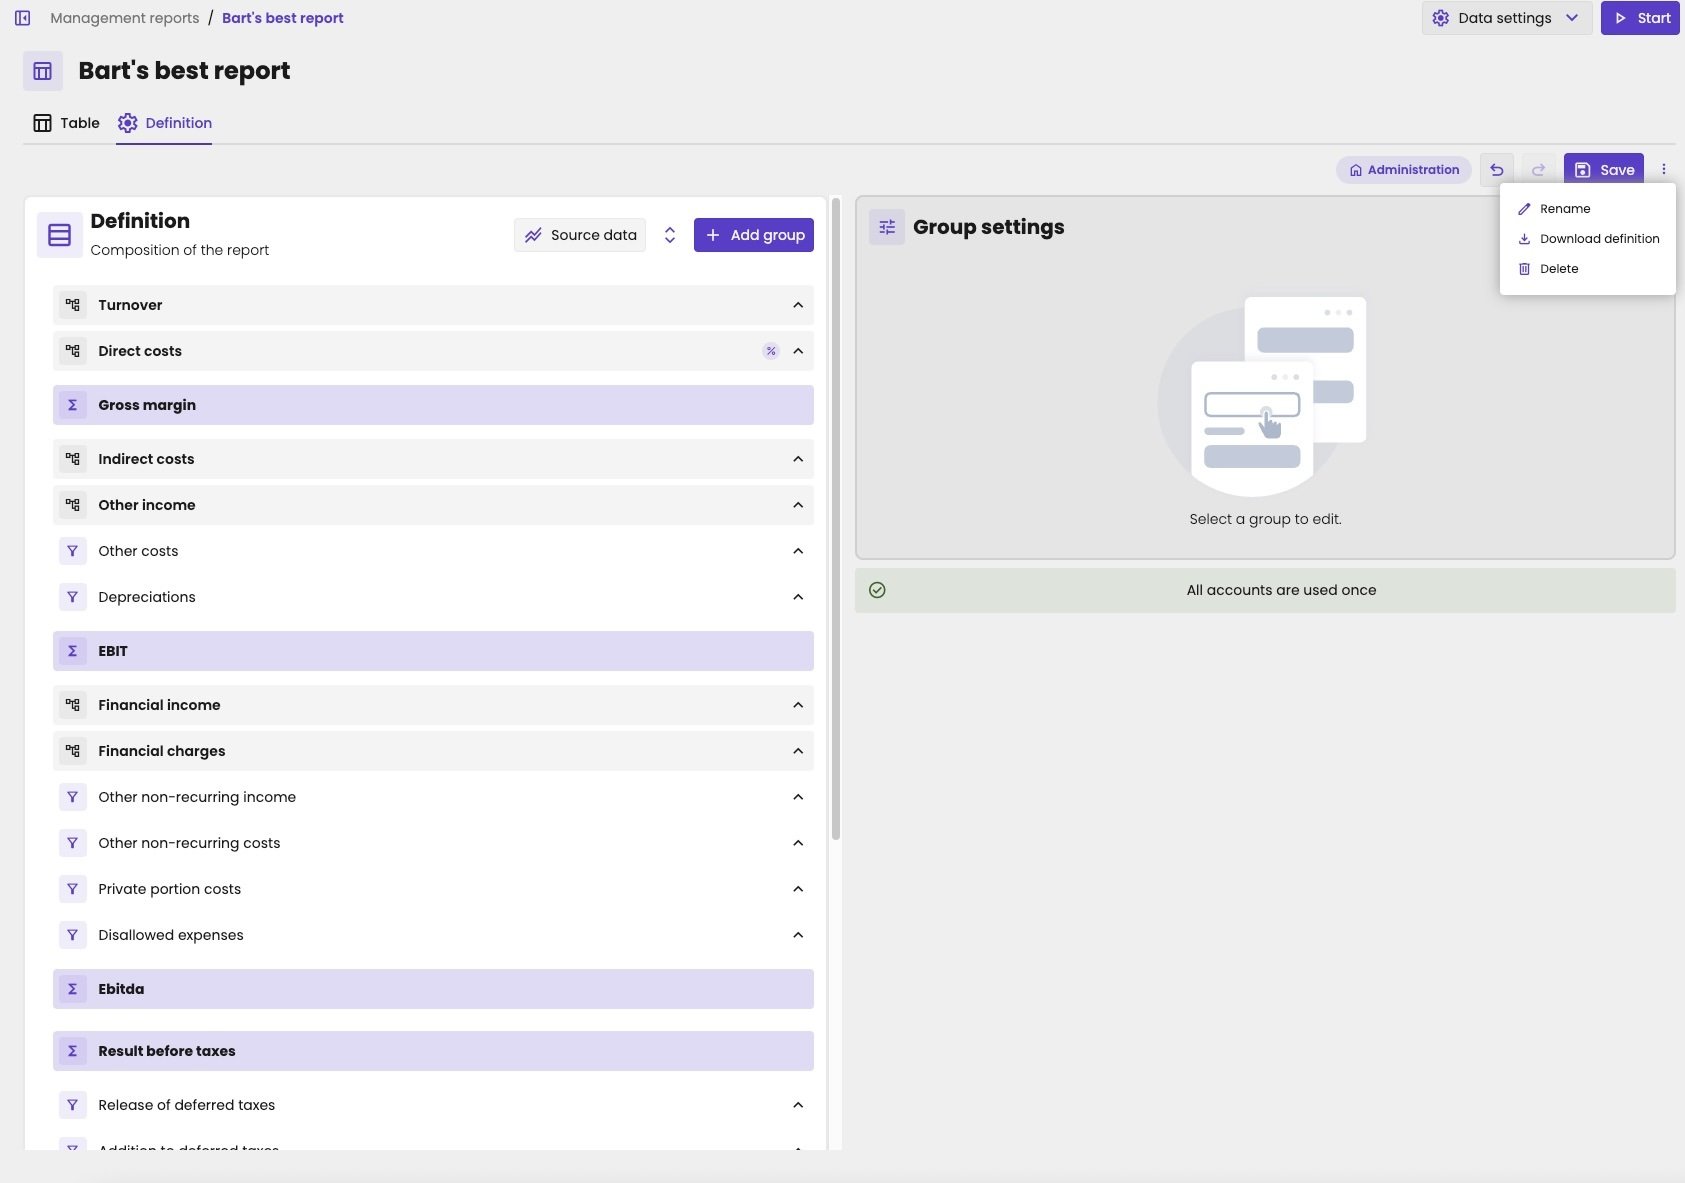
The editor shows the report without figures. Expand a group to see what’s in it, down to the GL accounts. aiGust checks the definition against the administration’s chart of accounts. See Check the accounts.
Management report Bart's best report on the Definition tab, next to Table. On the left, Definition, the composition of the report, with Source data, a button to expand or collapse all, and Add group. The groups are listed from Turnover and Direct costs, with a % icon on Direct costs, to Gross margin, Indirect costs, Other income, EBIT, Financial income, Financial charges, Ebitda and Result before taxes. Formulas such as Gross margin and EBIT are highlighted. On the right, Group settings, saying select a group to edit, and below it All accounts are used once. At the top right, Administration, undo, redo, Save, and the three-dots menu open with Rename, Download definition and Delete.

The definition of a management report, with the menu of the report open.

Source data

Click Source data to choose the figures the report works on. You choose one source for the whole report.
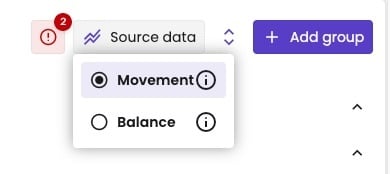
The Source data menu open, with the options Movement, selected, and Balance, each with an info icon. Next to it, a red icon with the number 2, the button to expand or collapse all, and Add group.

Choose the source data of the report.

The source decides how aiGust fills a column that covers several periods, such as a financial year or year to date:
  • Movement: aiGust adds up the periods in the column.
  • Balance: aiGust takes the balance at the end of the column’s last period.
Both sources work for every administration, also for one that only comes from a compliance connector, such as Silverfin. Its figures have no business partners, though, and are often only available per financial year: then the report has no quarter or period view.

Group types

Each group is one of three types:

Add a group

A new group is added at the level of the group you selected:
  1. Click a group at the level where you want the new group.
  2. Click Add group.
  3. Under Group settings, choose the type: Section, Formula or Line item.
  4. Enter the Name, in each language: NL, EN and FR.
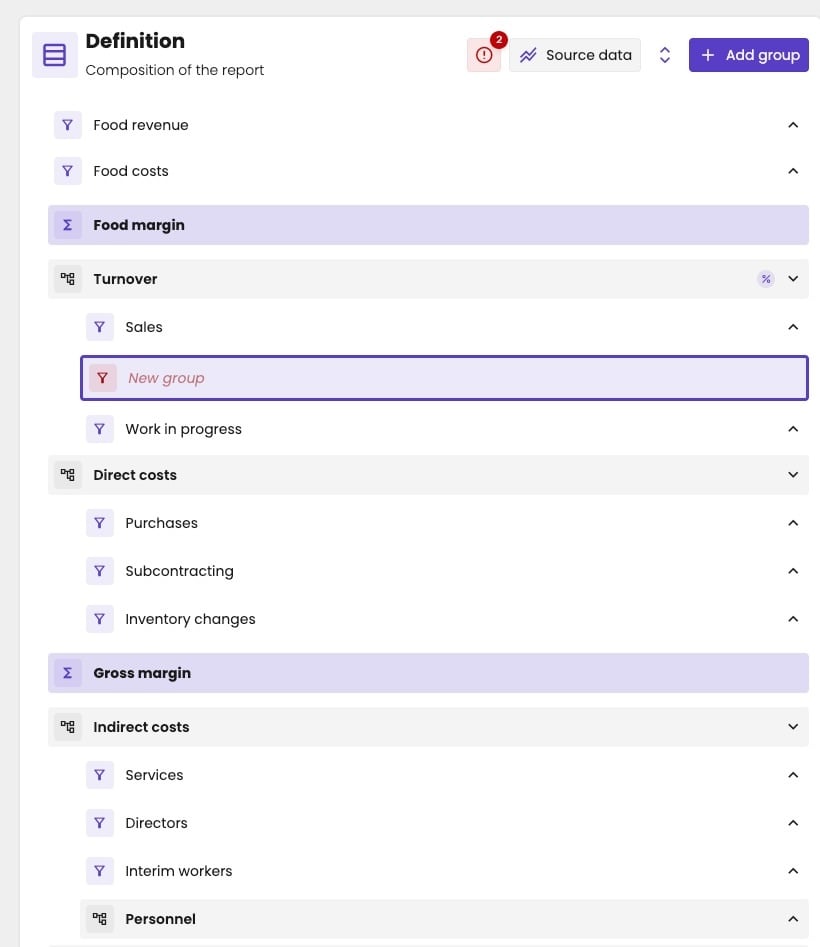
So to add a group at the top level, first click a group at the top level. To add a group in a section, click a group inside that section. To add the first group to a new, empty section, see Sections.
The definition with the sections Turnover, Direct costs and Indirect costs open. Inside Turnover, a New group marked in red sits between the line items Sales and Work in progress.

A new line item inside the Turnover section, between Sales and Work in progress.

Drag and drop groups to move them, also to another level. When a move isn’t allowed, a message appears and the group stays where it was. For example, you can’t move a top-level group into a section while a formula still uses it: formulas only use top-level groups. You can also drag accounts from one line item to another. See Move an account to another line item. A group without a name shows in red. The icon next to Source data counts what still needs your attention:
  • Red: errors, such as a group without a name in NL, EN or FR. You can’t save the report until you fix them.
  • Orange: warnings, such as accounts used in more than one line item. You can still save.

Group settings

Click a group to open its Group settings: To remove a group, click Delete group.

Change the type of a group

You can change the type of an existing group, but you lose what it holds:
  • From a section to a formula or a line item: all its subgroups are deleted.
  • From a line item to a section or a formula: all its filters are removed.
aiGust warns you before it changes the type, but take care: the subgroups or filters are gone. If it was a mistake, click the undo arrow to step back.

Vertical reference

Each report has one vertical reference: the line that aiGust calculates all percentages against. In a profit and loss, that’s usually the turnover. Turn on Use as vertical reference value in the settings of that group. A % icon marks it in the definition.

Check the accounts

The bar under the group settings shows whether every GL account is in exactly one line item: in green when it is, in red for unused accounts, and in orange for accounts used more than once. Click it to see which accounts. See Check the accounts.

Save your changes

Your changes aren’t saved automatically. Use the arrows to undo or redo a change, and click Save to keep them. You can’t save while the definition has errors, such as a group without a name in every language. See Add a group.