> ## Documentation Index
> Fetch the complete documentation index at: https://docs.ai-gust.io/llms.txt
> Use this file to discover all available pages before exploring further.
# KPIs and KPI types
> What KPIs are in aiGust, where they come from, and how the four KPI types (absolute value, horizontal delta, vertical value and vertical delta) help you read and benchmark them.
export const KpiTypeIcon = ({type}) => {
const paths = {
euro: "M600-120q-115 0-212.5-67.5T255-370H120v-60h123q-4-28-3.5-50t3.5-50H120v-60h135q35-115 132.5-182.5T600-840q69 0 129.5 23.5T840-748l-43 42q-41-36-92-55t-105-19q-94 0-171.5 52.5T319-590h281v60H304q-5 27-5 50t5 50h296v60H319q32 85 109.5 137.5T600-180q53 0 104-18t94-56l42 42q-44 42-107 67t-133 25Z",
numbers: "m239-160 40-159H120l15-60h159l51-202H186l15-60h159l39-159h59l-39 159h203l39-159h59l-39 159h159l-15 60H666l-51 202h159l-15 60H600l-40 159h-59l40-159H338l-40 159h-59Zm114-219h203l51-202H404l-51 202Z",
percent: "M289.9-540q-53.9 0-91.9-38.1-38-38.1-38-92t38.1-91.9q38.1-38 92-38t91.9 38.1q38 38.1 38 92T381.9-578q-38.1 38-92 38Zm-.02-60q29.12 0 49.62-20.38 20.5-20.38 20.5-49.5t-20.38-49.62q-20.38-20.5-49.5-20.5t-49.62 20.38q-20.5 20.38-20.5 49.5t20.38 49.62q20.38 20.5 49.5 20.5ZM669.9-160q-53.9 0-91.9-38.1-38-38.1-38-92t38.1-91.9q38.1-38 92-38t91.9 38.1q38 38.1 38 92T761.9-198q-38.1 38-92 38Zm49.6-80.38q20.5-20.38 20.5-49.5t-20.38-49.62q-20.38-20.5-49.5-20.5t-49.62 20.38q-20.5 20.38-20.5 49.5t20.38 49.62q20.38 20.5 49.5 20.5t49.62-20.38ZM202-160l-42-42 598-598 42 42-598 598Z",
trending_up: "m123-240-43-43 292-291 167 167 241-241H653v-60h227v227h-59v-123L538-321 371-488 123-240Z",
change_history: "m80-160 401-640 399 640H80Zm107-60h586L481-685 187-220Zm293-233Z"
};
const names = {
currency: "euro",
number: "numbers",
percentage: "percent",
vertical: "percent",
horizontal: "trending_up"
};
const style = {
display: "inline-block",
verticalAlign: "-0.2em"
};
if (type === "vertical-delta") {
return ;
}
const name = names[type] || "euro";
return ;
};
A KPI in aiGust is a financial or personnel figure for one administration, such as turnover, EBITDA, solvability or the number of employees. KPIs show up almost everywhere in aiGust. You use them to search administrations, set up triggers, build dashboards, compare with peer groups and add charts to meeting slides.
aiGust calculates every KPI for every financial year, year-to-date period, quarter and period of an administration. Each KPI can also be shown in up to four forms, called KPI types.
## Where KPIs come from
aiGust takes its KPIs from four sources:
| Source | Examples | Available |
| ------------------------------------------------------------------------------------- | ------------------------------------------------------------------------------------------------------------ | ------------------------------------------------------------------- |
| **Standard financial reports:** profit and loss, balance sheet and cash flow | Turnover, gross margin, EBITDA, personnel costs, total assets | For every administration |
| **Social balance sheet** | Number of employees, FTE | Only when [social data](/guide/personnel/data-sources) is available |
| **Financial ratios,** derived from the other sources | Customer credit, supplier credit, liquidity, solvability, added value, turnover per FTE, added value per FTE | For every administration, as far as the underlying data allows |
| **[aiGust labels](/guide/concepts/labels):** a selection of 61 profit and loss labels | Restaurant costs, energy costs, insurance | For every administration whose accounts are mapped to labels |
For the definition of each ratio, see the [ratio reference](/guide/reports/ratios).
The aiGust chart of accounts has many more labels, but only this selection of 61 profit and loss labels is available as KPIs. aiGust doesn't calculate KPIs for balance sheet labels.
### Why you can't change the standard definitions
The standard profit and loss, balance sheet and cash flow are the same for every administration, and you can't change their definitions. aiGust calculates the KPIs of all administrations in the background. Every administration must follow the same definitions, or its KPIs can't be compared with those of its peers.
To report in your own format, use [custom reports](/configure/reporting/custom-reports-overview). They live next to the standard reports and don't change the standard KPIs.
## KPI types
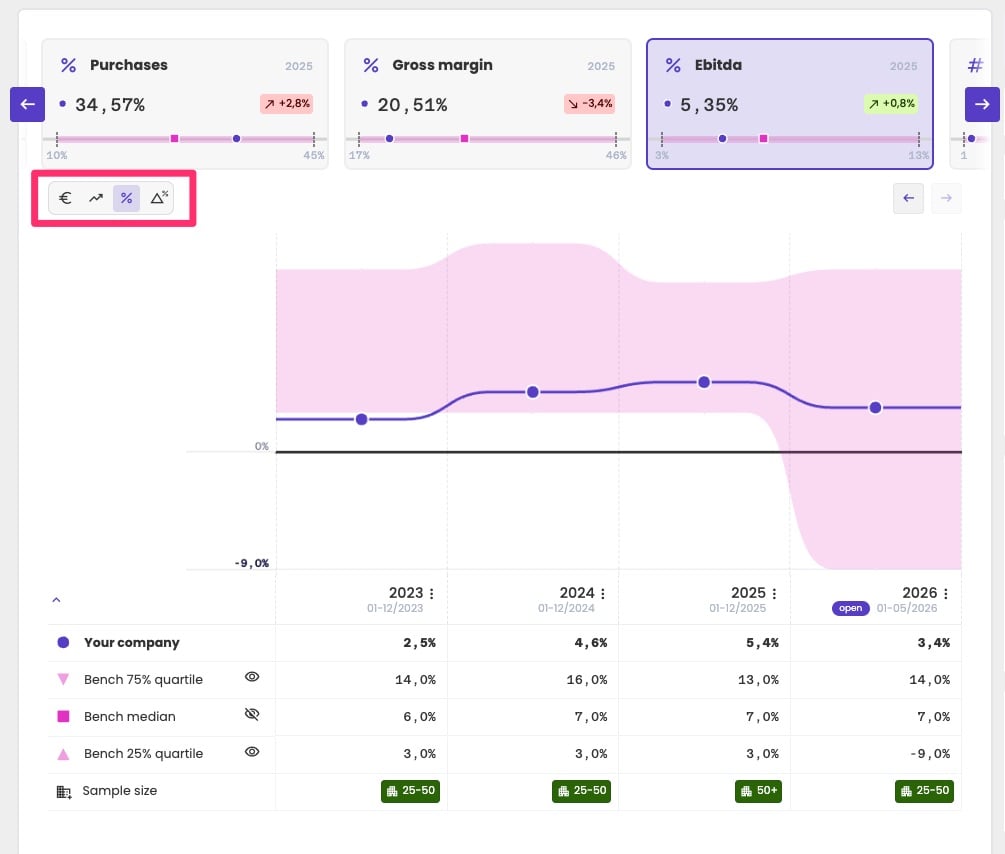
Most KPIs can be shown in four forms. You switch between them with the KPI type selector, a row of four icons.
| Icon | KPI type | What it shows | Example |
| ------------------------------------------------------------- | ---------------- | --------------------------------------------------------- | ------------------------------------------------- |
| | Absolute value | The value itself, in euro, as a number or as a percentage | Turnover of €7.35M, or customer credit of 45 days |
| | Horizontal delta | The change compared with the previous year, in % | Turnover grew by 60% |
| | Vertical value | The value as a share of a reference value | Gross margin is 20.5% of turnover |
| | Vertical delta | The change in the vertical value, in percentage points | Gross margin dropped from 45% to 40%: −5 pp |
Not every KPI has all four types. A ratio like customer credit, for example, has no vertical value.
### Absolute value
The value of the KPI itself. The icon shows its unit:
* **An amount in euro,** such as turnover. This applies to most KPIs.
* **A number,** such as customer credit in days or the number of employees.
* **A percentage,** for KPIs that are percentages by nature.
### Horizontal delta
The relative change compared with the previous year:
```
horizontal delta = (this year − previous year) / |previous year| × 100%
```
The formula divides by the absolute value of the previous year, so the sign always shows the right direction, even for negative values. A loss that shrinks from −€100,000 to −€50,000 is an improvement, and gives a horizontal delta of +50%.
If the previous year's value is 0 or missing, there's no horizontal delta.
### Vertical value
The KPI as a percentage of a reference value. Each standard report defines its own reference value:
| Report | Reference value |
| --------------- | ------------------------------------------------------------------- |
| Profit and loss | Turnover |
| Balance sheet | Balance sheet total (total assets, or total equity and liabilities) |
| Cash flow | None, so cash flow KPIs have no vertical value |
Label KPIs, such as energy costs, also have a vertical value: their share of turnover. Ratios like customer credit or solvability don't have one.
### Vertical delta
The change in the vertical value compared with the previous year, in percentage points (pp). If gross margin drops from 45% of turnover to 40%, the vertical delta is −5 pp.
A vertical delta is an absolute difference between two percentages, not a relative change. The same drop as a horizontal delta would be −11%.
## Choose the right KPI type
Which type tells you the most depends on the KPI and on your question:
* **Costs and margins:** look at the vertical value rather than the absolute value. Personnel costs of €400,000 say little by themselves. Personnel costs of 35% of turnover can be compared across years and with other companies.
* **Rising costs:** look at the vertical delta. It tells you whether a cost is growing faster than turnover. For example, are personnel costs rising compared with turnover, or does the company keep them in line?
* **Growth:** look at the horizontal delta, for example for turnover.
### KPI types in benchmarking
The choice matters even more when you [benchmark](/guide/benchmarking/how-it-works) an administration against a peer group:
* **Comparing absolute values of costs is rarely useful.** Peers differ in size, so benchmark personnel costs or margins as a vertical value.
* **To see how margins moved in the sector, benchmark the vertical delta, not the vertical value.** The benchmark of the vertical delta shows whether most peers kept their margins stable, or whether margins dropped across the board.
* **To see whether peers grew, benchmark the horizontal delta.** A benchmark of absolute turnover can't tell you whether most companies grew. A rising median turnover doesn't mean that most peers grew. Only the benchmark of the horizontal delta tells you that.
## Where you use KPIs
Find administrations by KPI, for example all companies whose turnover grew by more than 10%.
Get alerts when a KPI meets a rule, across all your administrations.
Follow the most important KPIs of an administration at a glance.
Compare an administration's KPIs with those of a peer group.
 | Icon | KPI type | What it shows | Example |
| ------------------------------------------------------------- | ---------------- | --------------------------------------------------------- | ------------------------------------------------- |
|
| Icon | KPI type | What it shows | Example |
| ------------------------------------------------------------- | ---------------- | --------------------------------------------------------- | ------------------------------------------------- |
|